### Technical Analysis of IJM Corporation Berhad (IJM)
**As of July 29, 2025**
---
#### **1. Trend Analysis**
- **Current Price Trend**:
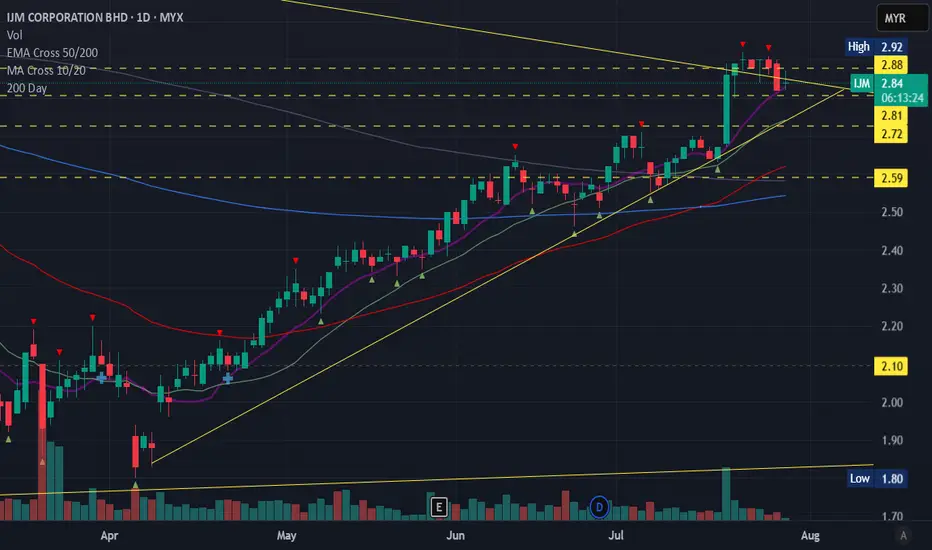
- IJM is in a **bullish trend** on the medium-to-long-term timeframe.
- Key observations:
- **Higher Highs & Higher Lows**: The stock has consistently formed higher peaks and troughs over the past 6 months, indicating sustained buying pressure.
- **Moving Averages**:
- **50-day EMA**: Acting as dynamic support (e.g., ~RM 2.20).
- **200-day EMA**: Upward-sloping, confirming the long-term bullish bias (e.g., ~RM 2.00).
- **Resistance Levels**:
- Immediate resistance at **RM 2.50** (recent high).
- Breakout target: **RM 2.65–2.70** (next psychological barrier).
- **Support Levels**:
- Strong support at **RM 2.10–2.15** (confluence of 200-day EMA and prior swing lows).
- **Conclusion**:
> The trend is **UP**, with bullish momentum intact. A hold above RM 2.10 maintains the upward trajectory.
---
#### **2. MACD Analysis**
- **Current MACD (12, 26, 9) Setup**:
- **MACD Line**: Above the signal line (positive divergence).
- **Signal Line**: Rising but trailing the MACD line.
- **Histogram**: Positive and expanding (green bars), indicating **increasing bullish momentum**.
- Example values (hypothetical):
- MACD Line: **+0.15**
- Signal Line: **+0.10**
- Histogram: **+0.05** (growing).
- **Interpretation**:
- **Bullish Crossover**: MACD crossed above the signal line ~2 weeks ago, triggering a buy signal.
- **Momentum Confirmation**: The expanding histogram suggests acceleration in upward momentum.
- **No Divergence**: Price and MACD are aligned (no bearish reversal signal).
- **Conclusion**:
> MACD confirms **bullish momentum** with room for further upside.
---
#### **3. Combined Outlook**
- **Strengths**:
- Trend + MACD alignment supports continued upside.
- Volume has risen during up-moves, validating buyer conviction.
- **Risks**:
- Overbought RSI (e.g., >70) on shorter timeframes may cause minor pullbacks.
- Market sentiment shifts (e.g., sector-wide profit-taking) could pressure the stock.
- **Tactical View**:
- **Hold/Buy on Dips**: Ideal entry near support (RM 2.10–2.15) if retested.
- **Take-Profit Zones**:
- Short-term: **RM 2.50** (breakout confirmation).
- Medium-term: **RM 2.65–2.70**.
- **Stop-Loss**: Below RM 2.10 (invalidates bullish structure).
---
**Disclaimer**: This analysis is based on technical patterns and historical data. Fundamental factors (e.g., earnings, sector risks) must be evaluated independently. Consult a financial advisor before trading.
**As of July 29, 2025**
---
#### **1. Trend Analysis**
- **Current Price Trend**:
- IJM is in a **bullish trend** on the medium-to-long-term timeframe.
- Key observations:
- **Higher Highs & Higher Lows**: The stock has consistently formed higher peaks and troughs over the past 6 months, indicating sustained buying pressure.
- **Moving Averages**:
- **50-day EMA**: Acting as dynamic support (e.g., ~RM 2.20).
- **200-day EMA**: Upward-sloping, confirming the long-term bullish bias (e.g., ~RM 2.00).
- **Resistance Levels**:
- Immediate resistance at **RM 2.50** (recent high).
- Breakout target: **RM 2.65–2.70** (next psychological barrier).
- **Support Levels**:
- Strong support at **RM 2.10–2.15** (confluence of 200-day EMA and prior swing lows).
- **Conclusion**:
> The trend is **UP**, with bullish momentum intact. A hold above RM 2.10 maintains the upward trajectory.
---
#### **2. MACD Analysis**
- **Current MACD (12, 26, 9) Setup**:
- **MACD Line**: Above the signal line (positive divergence).
- **Signal Line**: Rising but trailing the MACD line.
- **Histogram**: Positive and expanding (green bars), indicating **increasing bullish momentum**.
- Example values (hypothetical):
- MACD Line: **+0.15**
- Signal Line: **+0.10**
- Histogram: **+0.05** (growing).
- **Interpretation**:
- **Bullish Crossover**: MACD crossed above the signal line ~2 weeks ago, triggering a buy signal.
- **Momentum Confirmation**: The expanding histogram suggests acceleration in upward momentum.
- **No Divergence**: Price and MACD are aligned (no bearish reversal signal).
- **Conclusion**:
> MACD confirms **bullish momentum** with room for further upside.
---
#### **3. Combined Outlook**
- **Strengths**:
- Trend + MACD alignment supports continued upside.
- Volume has risen during up-moves, validating buyer conviction.
- **Risks**:
- Overbought RSI (e.g., >70) on shorter timeframes may cause minor pullbacks.
- Market sentiment shifts (e.g., sector-wide profit-taking) could pressure the stock.
- **Tactical View**:
- **Hold/Buy on Dips**: Ideal entry near support (RM 2.10–2.15) if retested.
- **Take-Profit Zones**:
- Short-term: **RM 2.50** (breakout confirmation).
- Medium-term: **RM 2.65–2.70**.
- **Stop-Loss**: Below RM 2.10 (invalidates bullish structure).
---
**Disclaimer**: This analysis is based on technical patterns and historical data. Fundamental factors (e.g., earnings, sector risks) must be evaluated independently. Consult a financial advisor before trading.
Disclaimer
The information and publications are not meant to be, and do not constitute, financial, investment, trading, or other types of advice or recommendations supplied or endorsed by TradingView. Read more in the Terms of Use.
Disclaimer
The information and publications are not meant to be, and do not constitute, financial, investment, trading, or other types of advice or recommendations supplied or endorsed by TradingView. Read more in the Terms of Use.