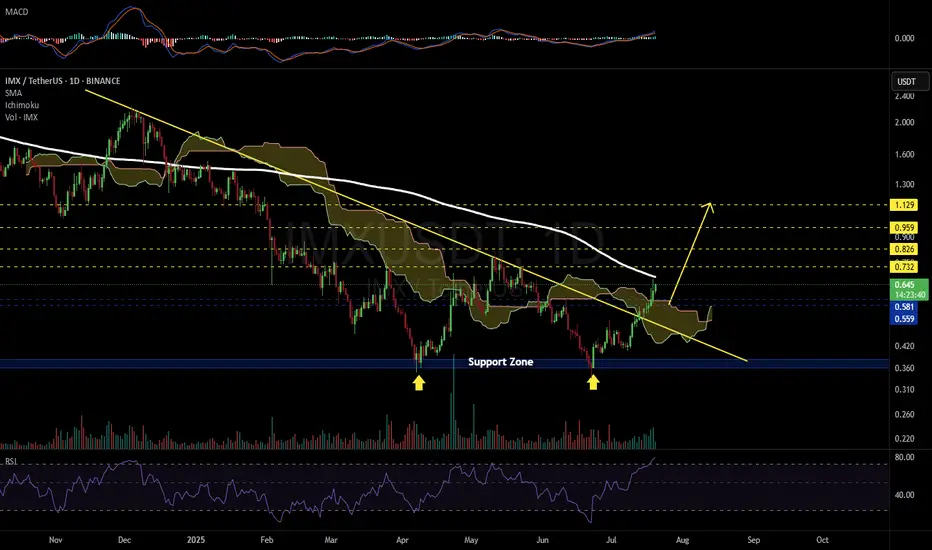
#IMX has broken above both the descending trendline and the Ichimoku Cloud on the daily chart — a strong bullish signal.
However, with RSI in the overbought zone and price nearing the daily SMA200, a rejection or short-term pullback is likely. A correction toward the $0.581–$0.559 range could offer a better entry.
💡 Consider placing buy orders in portions within that zone.
If IMX successfully breaks above the SMA200, the next targets will be:
🎯 $0.732
🎯 $0.826
🎯 $0.959
🎯 $1.129
⚠️ Always use a tight stop-loss and practice proper risk management.
Disclaimer
The information and publications are not meant to be, and do not constitute, financial, investment, trading, or other types of advice or recommendations supplied or endorsed by TradingView. Read more in the Terms of Use.
Disclaimer
The information and publications are not meant to be, and do not constitute, financial, investment, trading, or other types of advice or recommendations supplied or endorsed by TradingView. Read more in the Terms of Use.