Already had rallied.
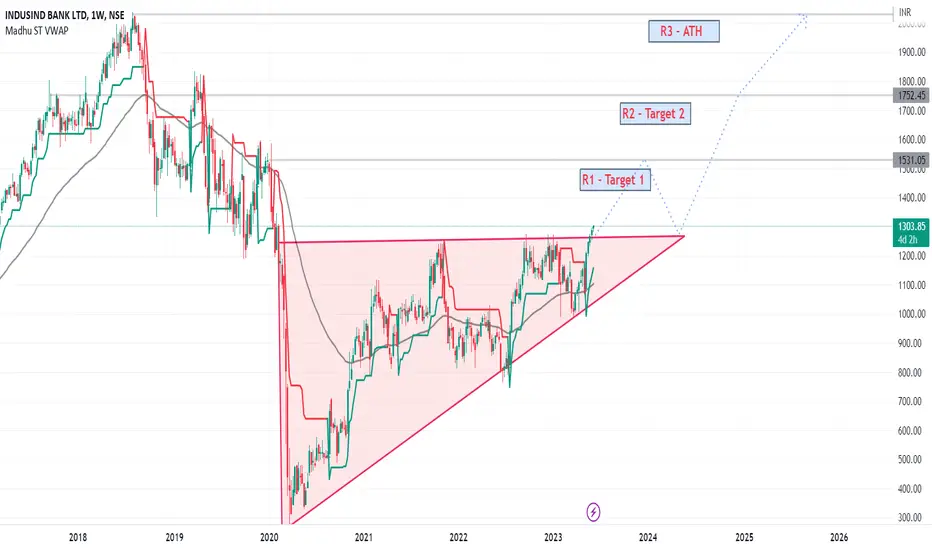
Ascending Triangle Breakout
Purely technical - Resistances and support given in chart
Market Cap
₹ 1,01,126 Cr.
Current Price
₹ 1,303
High / Low
₹ 1,304 / 763
Stock P/E
13.7
Book Value
₹ 616
Dividend Yield
1.09 %
ROCE
7.37 %
ROE
15.5 %
Face Value
₹ 10.0
Promoter holding
15.9 %
EPS last year
₹ 95.2
EPS latest quarter
₹ 26.3
Debt
₹ 3,41,005 Cr.
Pledged percentage
45.5 %
Net CF
₹ -11,843 Cr.
Price to Cash Flow
-8.13
Free Cash Flow
₹ -12,958 Cr.
Debt to equity
7.15
OPM last year
56.3 %
OPM 5Year
52.7 %
Reserves
₹ 46,923 Cr.
Price to book value
2.11
Int Coverage
1.53
PEG Ratio
0.88
Disclaimer
The information and publications are not meant to be, and do not constitute, financial, investment, trading, or other types of advice or recommendations supplied or endorsed by TradingView. Read more in the Terms of Use.
Disclaimer
The information and publications are not meant to be, and do not constitute, financial, investment, trading, or other types of advice or recommendations supplied or endorsed by TradingView. Read more in the Terms of Use.