After months of consolidation and a healthy correction, **DLF Ltd** is showing strong signs of **trend resumption**.
### 📊 Technical Highlights:
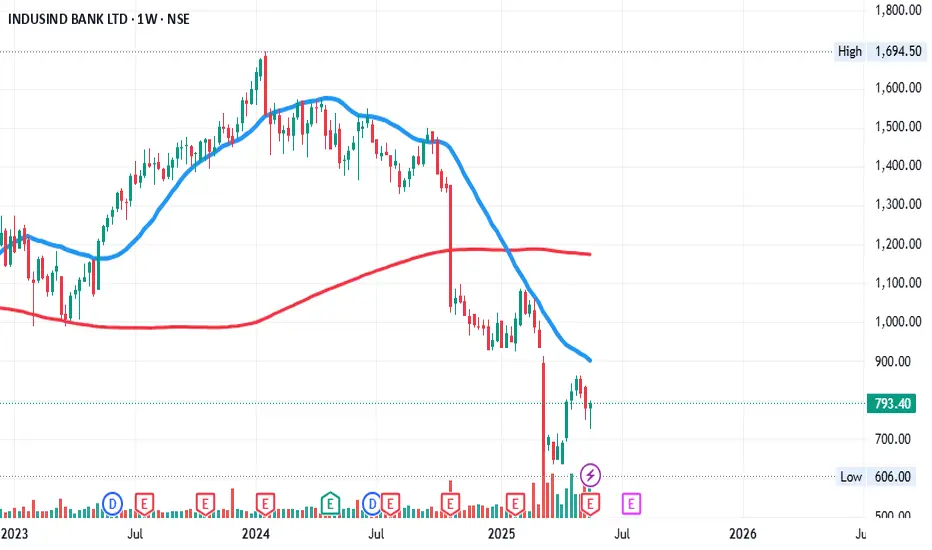
* ✅ **8.46% weekly gain** with strong bullish candle and volume.
* ✅ **Bounce from the 200-week EMA** (red line), a classic long-term support zone.
* ✅ Price is reclaiming the **20-week EMA** (blue line) after a multi-week downtrend — often an early signal of reversal.
* 🔁 **Higher low formation** visible on the weekly timeframe.
* 🔼 Looks poised for a fresh uptrend if follow-through buying comes in.
### 📌 Key Levels:
* **Resistance**: ₹820–₹850 (short-term supply zone)
* **Support**: ₹720–₹740 zone
* **Breakout Confirmation**: Above ₹800 with volume
* **Targets (Mid-term)**: ₹890 / ₹950 / ₹1020
### 🧠 Trading Plan:
* **Swing Traders**: Can consider entries near ₹750–₹765 with SL below ₹715.
* **Investors**: Ideal accumulation zone with long-term support in place and trend resumption setup forming.
### ⚠️ Risk Management:
* Always follow a stop-loss strategy.
* Position sizing according to portfolio risk tolerance.
This idea is for educational and informational purposes only. Always do your own research and consult with a financial advisor before trading or investing
Note
SORRY CHART BY MISTAKE OF INDUSIND BANK ... KINDLY READ THE CHART OF DLF I REPEAT DLFDisclaimer
The information and publications are not meant to be, and do not constitute, financial, investment, trading, or other types of advice or recommendations supplied or endorsed by TradingView. Read more in the Terms of Use.
Disclaimer
The information and publications are not meant to be, and do not constitute, financial, investment, trading, or other types of advice or recommendations supplied or endorsed by TradingView. Read more in the Terms of Use.