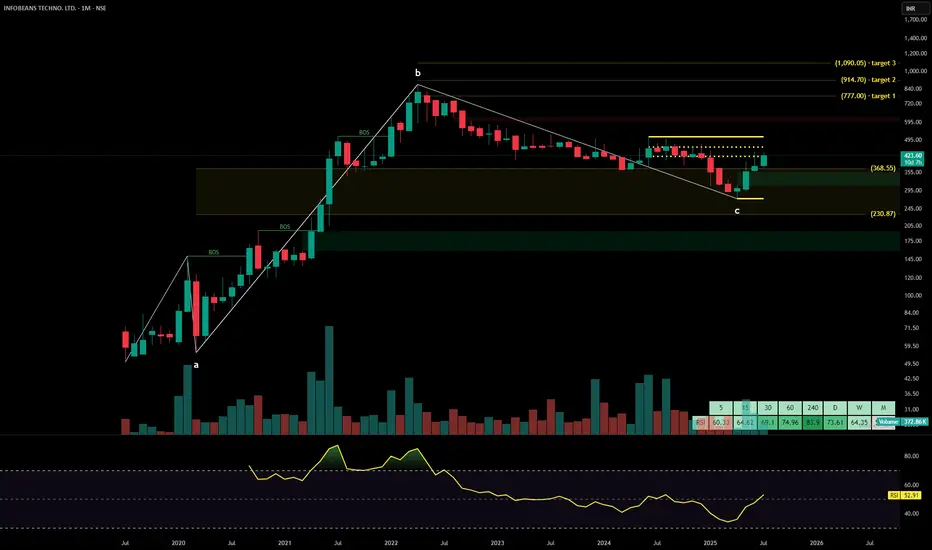
InfoBeans Technologies Ltd. is a digital transformation and product engineering company offering enterprise solutions, UX-led development, cloud services, and automation frameworks across global markets. With a client base spanning Fortune 500 companies and sectors such as healthcare, finance, and real estate, the company maintains a strong offshore delivery model and innovation culture. The stock is currently trading at ₹423.60.
InfoBeans Technologies Ltd. – FY22–FY25 Snapshot
Sales – ₹164 Cr → ₹198 Cr → ₹223 Cr → ₹249 Cr – Consistent growth through contract wins and diversification
Net Profit – ₹30.7 Cr → ₹35.8 Cr → ₹41.2 Cr → ₹47.6 Cr – Expanding margins backed by digital and automation
Company Order Book – Moderate → Strong → Strong → Strong – Robust pipeline in cloud modernization and UI/UX platforms
Dividend Yield (%) – 0.00% → 0.00% → 0.00% → 0.00% – Reinvestment-focused strategy with no distributions
Operating Performance – Moderate → Strong → Strong → Strong – SaaS-led leverage improving delivery efficiency
Equity Capital – ₹9.02 Cr (constant) – Lean capital structure without dilution
Total Debt – ₹0 Cr (debt-free) – Zero leverage, fully equity-financed operations
Total Liabilities – ₹72 Cr → ₹78 Cr → ₹84 Cr → ₹91 Cr – Gradual scale-up with delivery expansion
Fixed Assets – ₹28 Cr → ₹30 Cr → ₹33 Cr → ₹36 Cr – Light capex aligned to facility upgrades and automation tools
Latest Highlights FY25 net profit rose 15.5% YoY to ₹47.6 Cr; revenue increased 11.7% to ₹249 Cr EPS: ₹10.53 | EBITDA Margin: 28.3% | Net Margin: 19.11% Return on Equity: 24.86% | Return on Assets: 18.65% Promoter holding: 72.44% | Dividend Yield: 0.00% New service lines launched in DevOps automation and AI-powered enterprise apps Delivery centers expanded with focus on tier-2 cost-efficient tech hubs
Institutional Interest & Ownership Trends Promoter holding remains strong at 72.44% with zero pledging or dilution. Institutional activity is limited, typical of niche mid-caps, with HNI and PMS desk accumulation seen in volume spikes. Delivery trends signal quiet confidence from domestic tech-focused allocators.
Business Growth Verdict Yes, InfoBeans continues to compound steadily across enterprise digital domains Margins remain robust with operational discipline and client retention Debt-free balance sheet and consistent earnings boost investor visibility Capex is lean and well-aligned to growth without financial stress
Company Guidance Management projects double-digit revenue growth in FY26, driven by rising U.S. client demand, cloud migration services, and proprietary product offerings in AI-led automation.
Final Investment Verdict InfoBeans Technologies Ltd. represents a scalable, high-ROE digital services player with zero leverage and strong promoter backing. Its consistent profitability, efficient cost structure, and client retention across geographies position it well for long-term accumulation. The company’s focus on enterprise modernization and automation gives it durable relevance in mid-cap IT, appealing to investors seeking margin-stable, debt-free tech exposure.
Disclaimer
The information and publications are not meant to be, and do not constitute, financial, investment, trading, or other types of advice or recommendations supplied or endorsed by TradingView. Read more in the Terms of Use.
Disclaimer
The information and publications are not meant to be, and do not constitute, financial, investment, trading, or other types of advice or recommendations supplied or endorsed by TradingView. Read more in the Terms of Use.