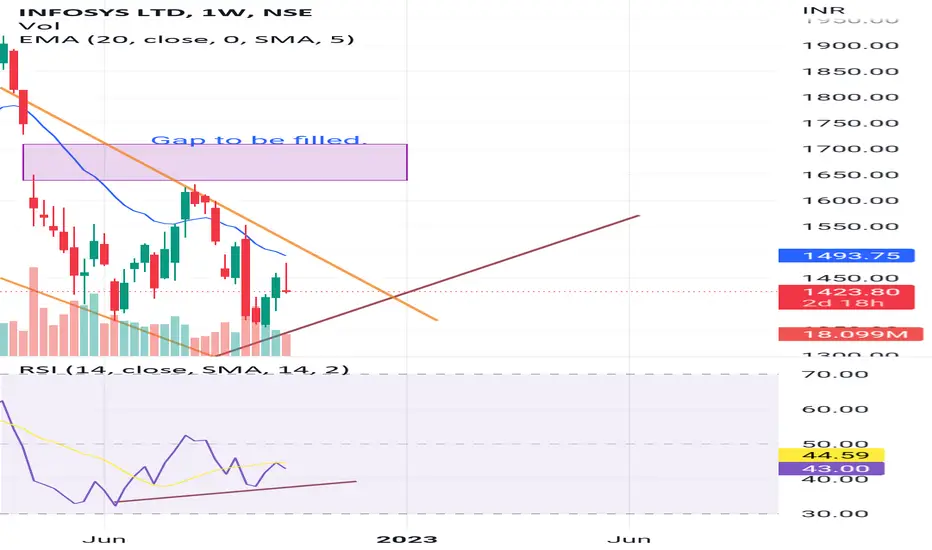
Monthly inverted hammer indicates trend reversal.
Daily near 20 ema.
RSI shows divergence.
PCR near to oversold.
Price below 50 ema.
A
Daily near 20 ema.
RSI shows divergence.
PCR near to oversold.
Price below 50 ema.
A
Disclaimer
The information and publications are not meant to be, and do not constitute, financial, investment, trading, or other types of advice or recommendations supplied or endorsed by TradingView. Read more in the Terms of Use.
Disclaimer
The information and publications are not meant to be, and do not constitute, financial, investment, trading, or other types of advice or recommendations supplied or endorsed by TradingView. Read more in the Terms of Use.