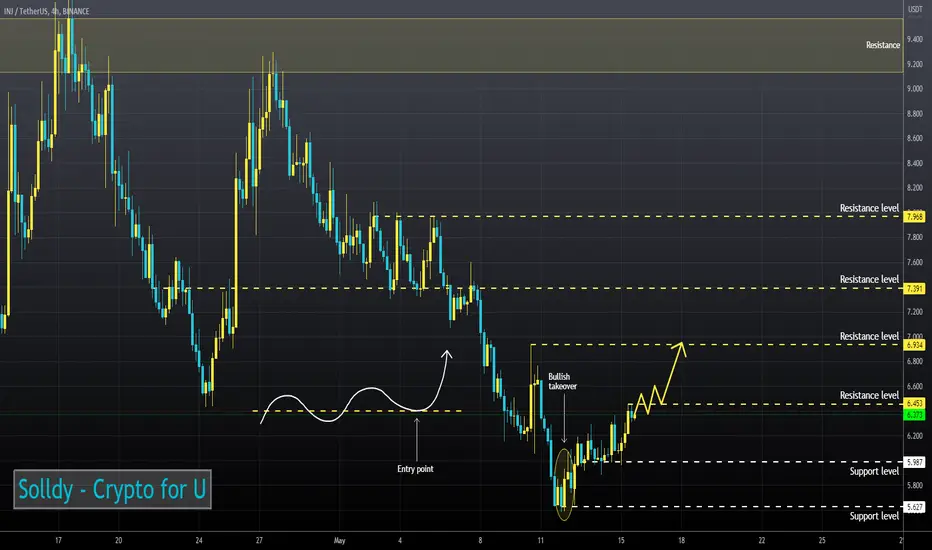
Trading volumes increased on the rebound.
The RSI chart entered the bullish zone (4H, 1H and 30m TFs).
Price broke up 200EMA on the 1H Timeframe.
50EMA has broken up 200EMA on the 30m Timeframe.
I believe that the asset will continue to rise after overcoming the resistance.
The RSI chart entered the bullish zone (4H, 1H and 30m TFs).
Price broke up 200EMA on the 1H Timeframe.
50EMA has broken up 200EMA on the 30m Timeframe.
I believe that the asset will continue to rise after overcoming the resistance.
Disclaimer
The information and publications are not meant to be, and do not constitute, financial, investment, trading, or other types of advice or recommendations supplied or endorsed by TradingView. Read more in the Terms of Use.
Disclaimer
The information and publications are not meant to be, and do not constitute, financial, investment, trading, or other types of advice or recommendations supplied or endorsed by TradingView. Read more in the Terms of Use.