Hello Crypto Lovers,
Mars Signals team wishes you high profits.
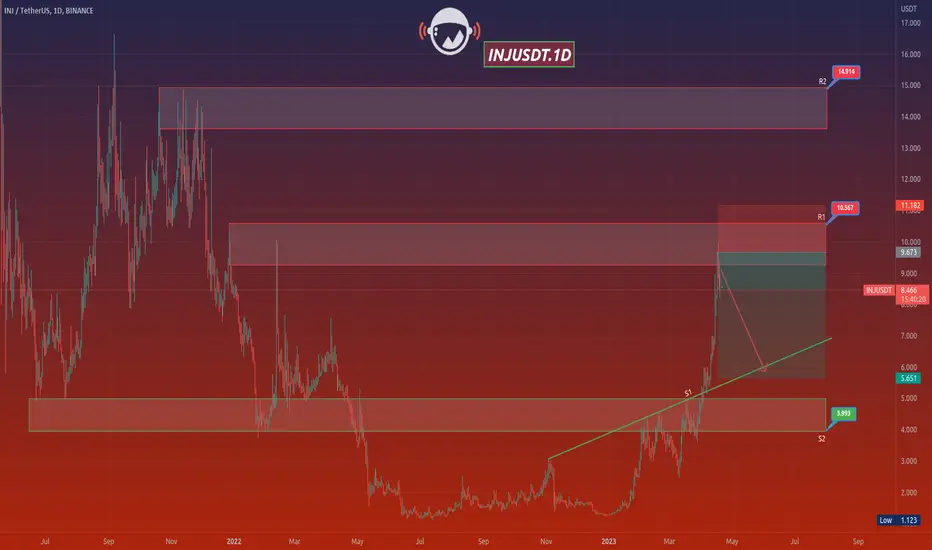
This is a one-day-time frame analysis for INJUSDT
R2 and R1 on the top of this chart are our resistance areas that represent the disability of the price to rise. S1 used to be a resistance line. And we have S2 that is a long-term support area with its support of price at different points even since the past. As it is obvious, the price had a rejection at R1 and by falling below S2, it had a fluctuation there for a while and then at its last triumph, it was able to break S2 upward and reached R1. At the moment, we see the price had a noticeable rise and now it is fluctuating below R1 area. It is predicted to resume its decline down to S1 or even by rising a bit to our stop-loss point, a rejection would happen then. So by activation of our short position, a fall is expected for the price to lower amounts. Also, when S1 is lost, more fall is there for the price toward S2 area. You should check every detail and information before putting your trade orders and then wait for a proper time to have your next action. In case you are looking for wise trades and less risky ones, our suggestion will be following our regular updates all the time.
Warning: This is just a suggestion and we do not guarantee profits. We advise you to analyze the chart before opening any positions.
Have a great time
Mars Signals team wishes you high profits.
This is a one-day-time frame analysis for INJUSDT
R2 and R1 on the top of this chart are our resistance areas that represent the disability of the price to rise. S1 used to be a resistance line. And we have S2 that is a long-term support area with its support of price at different points even since the past. As it is obvious, the price had a rejection at R1 and by falling below S2, it had a fluctuation there for a while and then at its last triumph, it was able to break S2 upward and reached R1. At the moment, we see the price had a noticeable rise and now it is fluctuating below R1 area. It is predicted to resume its decline down to S1 or even by rising a bit to our stop-loss point, a rejection would happen then. So by activation of our short position, a fall is expected for the price to lower amounts. Also, when S1 is lost, more fall is there for the price toward S2 area. You should check every detail and information before putting your trade orders and then wait for a proper time to have your next action. In case you are looking for wise trades and less risky ones, our suggestion will be following our regular updates all the time.
Warning: This is just a suggestion and we do not guarantee profits. We advise you to analyze the chart before opening any positions.
Have a great time
Disclaimer
The information and publications are not meant to be, and do not constitute, financial, investment, trading, or other types of advice or recommendations supplied or endorsed by TradingView. Read more in the Terms of Use.
Disclaimer
The information and publications are not meant to be, and do not constitute, financial, investment, trading, or other types of advice or recommendations supplied or endorsed by TradingView. Read more in the Terms of Use.