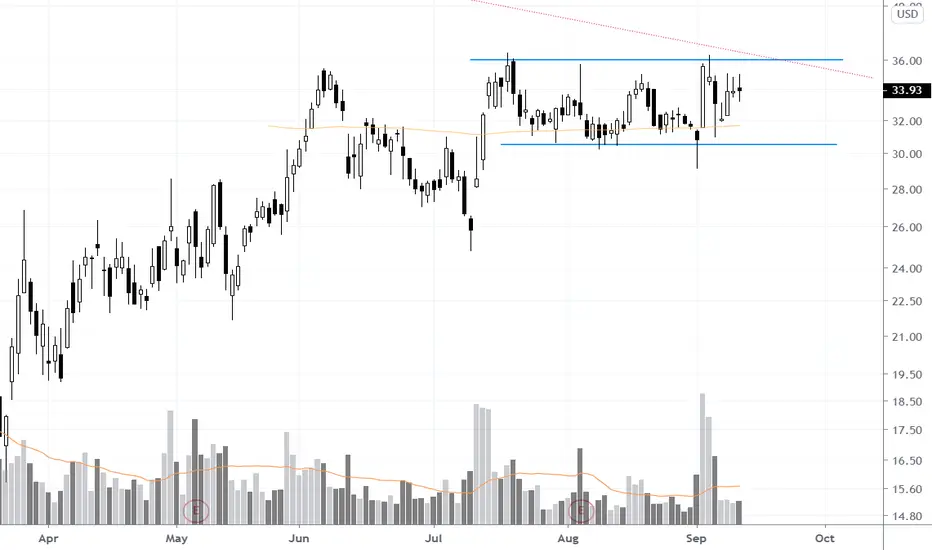
3 reasons to like this rectangle breakout chart pattern. A daily close above $36.75 will:
1) Confirm breakout above 200 MA
2) Clear 2 month consolidation chart pattern
3) Clear weekly down sloping trend line (red dotted line on chart)
1) Confirm breakout above 200 MA
2) Clear 2 month consolidation chart pattern
3) Clear weekly down sloping trend line (red dotted line on chart)
✔ Momentum & Breakout Trader Since 2006 | Influenced by Mark Minervini VCP Trading Style & William O'Neil CANSLIM 📈
✔ Follow me on Twitter @taplot - twitter.com/TaPlot
✔ YouTube channel youtube.com/@taplot
✔ Follow me on Twitter @taplot - twitter.com/TaPlot
✔ YouTube channel youtube.com/@taplot
Disclaimer
The information and publications are not meant to be, and do not constitute, financial, investment, trading, or other types of advice or recommendations supplied or endorsed by TradingView. Read more in the Terms of Use.