INOX GREEN LIMITED 📊
1. Key Levels
2. Trade Setup
3. Confirmation Signals
4. Risk Management
Why This Plan Works
Elliott Wave Alignment: The chart indicates the completion of a bearish Wave 5 structure near a demand zone, signaling a reversal opportunity.
Retracement Zone Logic: The 113-127% retracement zone is a proven technical area for trend reversals or continuation patterns.
Clear Confirmation Criteria: Waiting for volume spikes, candlestick patterns, and BoS ensures higher probability entries.
Disclaimer:
I am not a SEBI-registered analyst. This trading plan is for educational purposes only. Please do your research or consult with a financial advisor before trading.
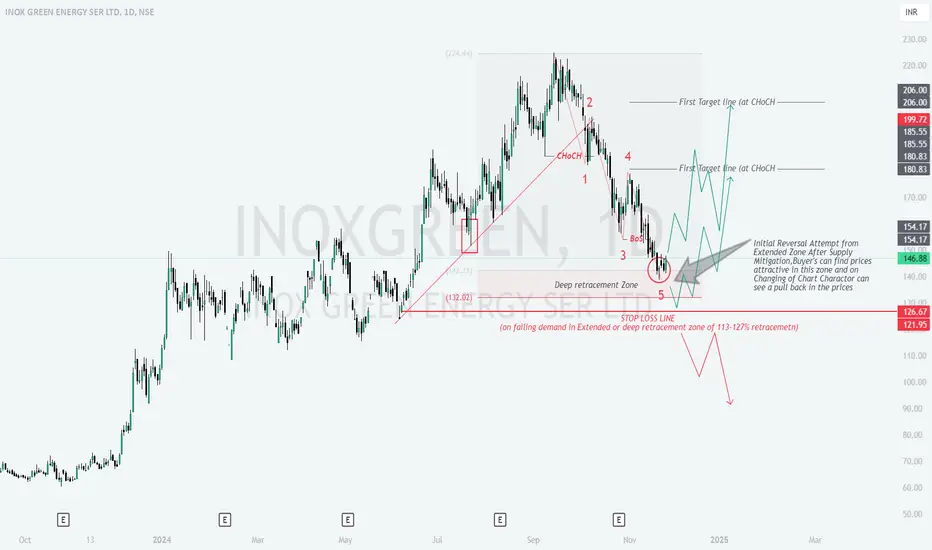
1. Key Levels
- Deep Retracement Zone (₹142-132):
This zone represents the 113-127% retracement, often considered a hotspot for institutional buying.
Price stabilization is likely due to the combination of technical demand and psychological support levels. - Stop Loss (₹126-121):
Failure to sustain above this zone invalidates the demand setup and signals further downside momentum. - Targets:
First Target (₹180-185): Marks the Change of Character (ChoCH), indicating potential trend reversal.
Second Target (₹200-206): A significant resistance zone, where selling pressure might emerge due to extended retracement.
2. Trade Setup
- A. Long Trade Setup:Why Long?
The market is completing a Wave 5 structure near the demand zone.
Reversals frequently occur here, often accompanied by signs of downtrend exhaustion.
Entry: Near ₹132-127, after confirming bullish candlesticks or rising volumes.
Stop Loss: Below ₹121, to minimize risk if the demand zone fails.
Targets:
₹180-185: A breakout here confirms buyers are regaining control.
₹200-206: Extended retracement zone where resistance may develop. - B. Short Trade Setup (If Demand Fails):Why Short?
A breakdown below ₹121 confirms the demand zone failure, signaling further downside momentum.
Entry: Below ₹121, after a confirmed breakdown.
Targets:
₹100-90: The next significant support levels.
Stop Loss: Above ₹127, to protect against losses if the price reclaims the broken demand zone.
3. Confirmation Signals
- Bullish Reversal Indicators for Long Entry:
Candlestick patterns (e.g., hammer, bullish engulfing) near ₹127-132.
Volume spikes during upward moves suggest institutional buying activity.
Break of Structure (BoS) above ₹150 confirms a bullish trend reversal. - Bearish Breakdown Indicators for Short Entry:
Price closes below ₹121 with high volume, confirming demand failure.
4. Risk Management
- Why Manage Risk?
Reversals or breakdowns may fail; a predefined Stop Loss limits potential losses. - Risk-to-Reward Ratio (R:R):
Maintain a minimum R:R ratio of 1:2 for favorable trade setups. - Position Sizing:
Limit exposure to 1-2% of your total capital per trade to manage risk effectively.
Why This Plan Works
Elliott Wave Alignment: The chart indicates the completion of a bearish Wave 5 structure near a demand zone, signaling a reversal opportunity.
Retracement Zone Logic: The 113-127% retracement zone is a proven technical area for trend reversals or continuation patterns.
Clear Confirmation Criteria: Waiting for volume spikes, candlestick patterns, and BoS ensures higher probability entries.
Disclaimer:
I am not a SEBI-registered analyst. This trading plan is for educational purposes only. Please do your research or consult with a financial advisor before trading.
Trade active
First Target AchivedDisclaimer
The information and publications are not meant to be, and do not constitute, financial, investment, trading, or other types of advice or recommendations supplied or endorsed by TradingView. Read more in the Terms of Use.
Disclaimer
The information and publications are not meant to be, and do not constitute, financial, investment, trading, or other types of advice or recommendations supplied or endorsed by TradingView. Read more in the Terms of Use.