INTUIT: A Strategic Opportunity After Multi-Year Resistance Break
First Impressions: Standing at a Critical Decision Point
Looking at these Intuit chart, I get that familiar feeling every investor knows, am I looking at opportunity or danger?
After years of testing a massive resistance zone around $700-750, INTU finally broke through to new all-time highs earlier this year. But now, like many growth stocks in this AI-driven market, it's pulled back to test that same resistance level that held it captive for years.
This is the kind of moment that separates patient investors from those who chase momentum. The stock has dropped about 15% from its recent highs around $790, and my gut reaction? This looks like a textbook retest of broken resistance turning into support, exactly what Chart Patterns teaches us to watch for.
Pattern Recognition: The Power of Multi-Year Resistance Breakouts
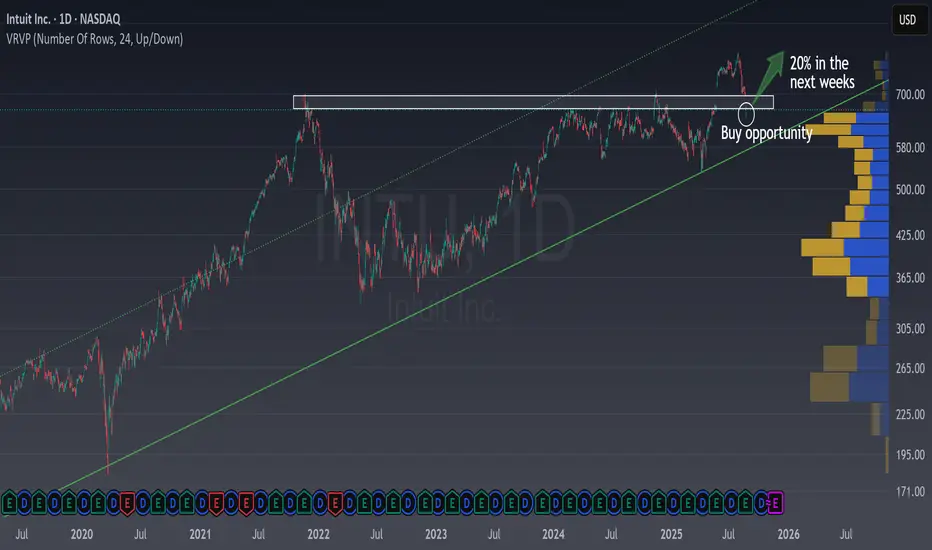
What immediately catches my eye is the multi-year resistance zone highlighted in white on the first chart. This isn't just any resistance level, it's been tested multiple times over several years, making it incredibly significant. When such major resistance finally breaks, the psychology shifts dramatically.
The pattern here follows a classic sequence:
Years of consolidation below the $700-750 resistance
Clean breakout to new highs around $790
Pullback to retest the broken resistance as new support
Strong buying interest emerging right at the support level (notice that green hammer candle!!). This kind of candle is what you must be looking for in this job.
This reminds me of a castle wall that finally gets breache, once you're through, that same wall becomes your fortress wall protecting you from attacks. The statistics support this view, resistance-turned-support levels have high reliability when they hold on retests. And furthermore, you can do a large profit by risking a bit, in this case you could earn a 20% by risking a 4%.
If we look the historical chart, it provides even more context with its long-term ascending trendline spanning over a decade. This shows Intuit's incredible 22% annualized return track record, which aligns perfectly with the company's fundamental strengths in financial software and recent AI innovations.

Analyst & Fundamental Context: The Numbers Tell a Bullish Story
This is where the Chart Patterns setup gets even more compelling. Wall Street analysts are remarkably bullish on INTU, with a consensus "Buy" rating and an average price target of $797-835. That's roughly 20-25% upside from current levels around $662.
Yes, that's exactly what technical analysis is telling us. A 20% bull run is more than posible here.
The fundamental backdrop couldn't be stronger:
What's fascinating is how the technical pullback contradicts the fundamental strength, classic market behavior where short-term fear creates long-term opportunity.
The company is executing flawlessly on its AI strategy with "Intuit Assist," yet the stock trades like there's fundamental weakness.
Investment Idea: A High-Probability Risk/Reward Setup
The Idea Setup:
Entry: Buy at market open around current levels ($662-665)
Stop Loss: Just below the support hammer candle at approximately $635 (4% risk). This is a very tight Stop Loss, but should be enough. If the price falls below the minimum price done Friday, I would prefer to invest in another stock.
Target: 20% return to $795-800 zone (no need to see new all time highs)
Risk/Reward Ratio: 5:1 (exceptional)
The Psychology Behind This Trade:
Think of this like buying a house in a great neighborhood that just got rezoned for higher value. The multi-year resistance breakout "rezoned" INTU to a higher valuation tier. Now we're getting a chance to buy at the old ceiling, which has become the new floor.
The green hammer candle that formed right at support tells a powerful story, institutional buyers stepped in aggressively the moment price touched this critical level. This suggests smart money recognizes the value at these levels.
Risk Management Strategy:
With only 4% downside risk to our stop loss, this setup offers asymmetric risk/reward. If the support fails, INTU would likely enter a more complex sideways range, but the long-term uptrend remains intact with that ascending trendline providing ultimate support. Remember, I'm trading to win in the upcoming weeks, not for the long run.
Timeline Expectations:
I expect this trade to play out over 2-6 weeks. We don't need new highs to make excellent money, just a return to the $795-800 consolidation zone where the stock can build a platform for its next move higher. The 20% target represents the distance back to where institutional resistance likely turns into support.
This is the kind of setup where patience meets opportunity. The market has given us a gift, the chance to buy a fundamentally strong, AI-powered growth story at a technical support level that has years of significance behind it. Sometimes the best investments are the ones that feel slightly uncomfortable in the moment but make perfect sense when you look at the bigger picture.
First Impressions: Standing at a Critical Decision Point
Looking at these Intuit chart, I get that familiar feeling every investor knows, am I looking at opportunity or danger?
After years of testing a massive resistance zone around $700-750, INTU finally broke through to new all-time highs earlier this year. But now, like many growth stocks in this AI-driven market, it's pulled back to test that same resistance level that held it captive for years.
This is the kind of moment that separates patient investors from those who chase momentum. The stock has dropped about 15% from its recent highs around $790, and my gut reaction? This looks like a textbook retest of broken resistance turning into support, exactly what Chart Patterns teaches us to watch for.
Pattern Recognition: The Power of Multi-Year Resistance Breakouts
What immediately catches my eye is the multi-year resistance zone highlighted in white on the first chart. This isn't just any resistance level, it's been tested multiple times over several years, making it incredibly significant. When such major resistance finally breaks, the psychology shifts dramatically.
The pattern here follows a classic sequence:
Years of consolidation below the $700-750 resistance
Clean breakout to new highs around $790
Pullback to retest the broken resistance as new support
Strong buying interest emerging right at the support level (notice that green hammer candle!!). This kind of candle is what you must be looking for in this job.
This reminds me of a castle wall that finally gets breache, once you're through, that same wall becomes your fortress wall protecting you from attacks. The statistics support this view, resistance-turned-support levels have high reliability when they hold on retests. And furthermore, you can do a large profit by risking a bit, in this case you could earn a 20% by risking a 4%.
If we look the historical chart, it provides even more context with its long-term ascending trendline spanning over a decade. This shows Intuit's incredible 22% annualized return track record, which aligns perfectly with the company's fundamental strengths in financial software and recent AI innovations.
Analyst & Fundamental Context: The Numbers Tell a Bullish Story
This is where the Chart Patterns setup gets even more compelling. Wall Street analysts are remarkably bullish on INTU, with a consensus "Buy" rating and an average price target of $797-835. That's roughly 20-25% upside from current levels around $662.
Yes, that's exactly what technical analysis is telling us. A 20% bull run is more than posible here.
The fundamental backdrop couldn't be stronger:
- Q2 2025 earnings crushed expectations with EPS of $3.32 vs. $2.58 expected
- Revenue grew 17% year-over-year to $4 billion
- Global Business Solutions segment up 19%, driven by AI-powered QuickBooks innovations
- Credit Karma revenue surged 36%
What's fascinating is how the technical pullback contradicts the fundamental strength, classic market behavior where short-term fear creates long-term opportunity.
The company is executing flawlessly on its AI strategy with "Intuit Assist," yet the stock trades like there's fundamental weakness.
Investment Idea: A High-Probability Risk/Reward Setup
The Idea Setup:
Entry: Buy at market open around current levels ($662-665)
Stop Loss: Just below the support hammer candle at approximately $635 (4% risk). This is a very tight Stop Loss, but should be enough. If the price falls below the minimum price done Friday, I would prefer to invest in another stock.
Target: 20% return to $795-800 zone (no need to see new all time highs)
Risk/Reward Ratio: 5:1 (exceptional)
The Psychology Behind This Trade:
Think of this like buying a house in a great neighborhood that just got rezoned for higher value. The multi-year resistance breakout "rezoned" INTU to a higher valuation tier. Now we're getting a chance to buy at the old ceiling, which has become the new floor.
The green hammer candle that formed right at support tells a powerful story, institutional buyers stepped in aggressively the moment price touched this critical level. This suggests smart money recognizes the value at these levels.
Risk Management Strategy:
With only 4% downside risk to our stop loss, this setup offers asymmetric risk/reward. If the support fails, INTU would likely enter a more complex sideways range, but the long-term uptrend remains intact with that ascending trendline providing ultimate support. Remember, I'm trading to win in the upcoming weeks, not for the long run.
Timeline Expectations:
I expect this trade to play out over 2-6 weeks. We don't need new highs to make excellent money, just a return to the $795-800 consolidation zone where the stock can build a platform for its next move higher. The 20% target represents the distance back to where institutional resistance likely turns into support.
This is the kind of setup where patience meets opportunity. The market has given us a gift, the chance to buy a fundamentally strong, AI-powered growth story at a technical support level that has years of significance behind it. Sometimes the best investments are the ones that feel slightly uncomfortable in the moment but make perfect sense when you look at the bigger picture.
⚡ Trading is not about luck or patience. Is about skills and knowledge. ⚡
I share my ideas, returns and knowledge here:
📚 👉 topchartpatterns.substack.com/subscribe 👈📚
🤝 Business contact: info@topchartpatterns.com
I share my ideas, returns and knowledge here:
📚 👉 topchartpatterns.substack.com/subscribe 👈📚
🤝 Business contact: info@topchartpatterns.com
Related publications
Disclaimer
The information and publications are not meant to be, and do not constitute, financial, investment, trading, or other types of advice or recommendations supplied or endorsed by TradingView. Read more in the Terms of Use.