IOC Technical Analysis Summary- Based on various sources, the technical analysis of IOC is currently mixed
Indicators: Some indicators suggest a bearish trend, while others are neutral. There have been recent bearish signals including a price drop, a bearish crossover on the MACD, and overbought indicators falling back down.
Overall Ratings: At present I will give a neutral technical rating for IOC, although the 1-month rating shows a buy signal.
Moving Averages: Mixed signals, with some suggesting sell and others buy.
Important to Remember:
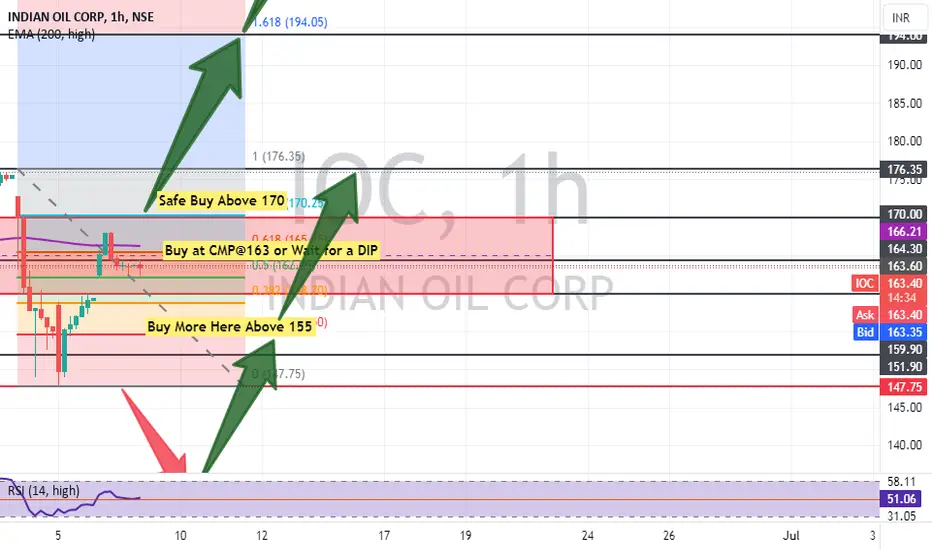
IOC Support and Resistance Levels:- Here's a breakdown of recent support and resistance levels for IOC
Support Levels:
S1: 161.1
S2: 158.7
S3: 155.2
100-Day Moving Average: 158.5 (approx)
200-Day Moving Average: 141.5 (approx)
Resistance Levels::-
R1: 167.1
R2: 170.6
R3: ₹173.0 [3]
These levels are based on recent price action and may change as the stock price fluctuates.
It's important to consult live charts to see the most up-to-date support and resistance levels.
Remember, support and resistance levels are not guarantees, but they can be helpful indicators of where the stock price might find buyers or sellers.
Do your own research: Technical analysis is just one factor to consider when making investment decisions. You should also consider the company's fundamentals, news, and overall market conditions.
Thanks for your support as always
Disclaimer: I am not a financial advisor and this is not financial advice. Please do your own research before making any investment decisions.
Indicators: Some indicators suggest a bearish trend, while others are neutral. There have been recent bearish signals including a price drop, a bearish crossover on the MACD, and overbought indicators falling back down.
Overall Ratings: At present I will give a neutral technical rating for IOC, although the 1-month rating shows a buy signal.
Moving Averages: Mixed signals, with some suggesting sell and others buy.
Important to Remember:
- Technical analysis is not a perfect science and should only be used as one factor in making investment decisions.
- Market conditions can change rapidly, so it's important to stay up-to-date on the latest news and analysis.
- Consider fundamental analysis, which looks at the company's financial health and future prospects, alongside technical analysis.
IOC Support and Resistance Levels:- Here's a breakdown of recent support and resistance levels for IOC
Support Levels:
S1: 161.1
S2: 158.7
S3: 155.2
100-Day Moving Average: 158.5 (approx)
200-Day Moving Average: 141.5 (approx)
Resistance Levels::-
R1: 167.1
R2: 170.6
R3: ₹173.0 [3]
These levels are based on recent price action and may change as the stock price fluctuates.
It's important to consult live charts to see the most up-to-date support and resistance levels.
Remember, support and resistance levels are not guarantees, but they can be helpful indicators of where the stock price might find buyers or sellers.
Do your own research: Technical analysis is just one factor to consider when making investment decisions. You should also consider the company's fundamentals, news, and overall market conditions.
Thanks for your support as always
Disclaimer: I am not a financial advisor and this is not financial advice. Please do your own research before making any investment decisions.
Disclaimer
The information and publications are not meant to be, and do not constitute, financial, investment, trading, or other types of advice or recommendations supplied or endorsed by TradingView. Read more in the Terms of Use.
Disclaimer
The information and publications are not meant to be, and do not constitute, financial, investment, trading, or other types of advice or recommendations supplied or endorsed by TradingView. Read more in the Terms of Use.