Updated
IOSTBTC Expected decrease and bounce
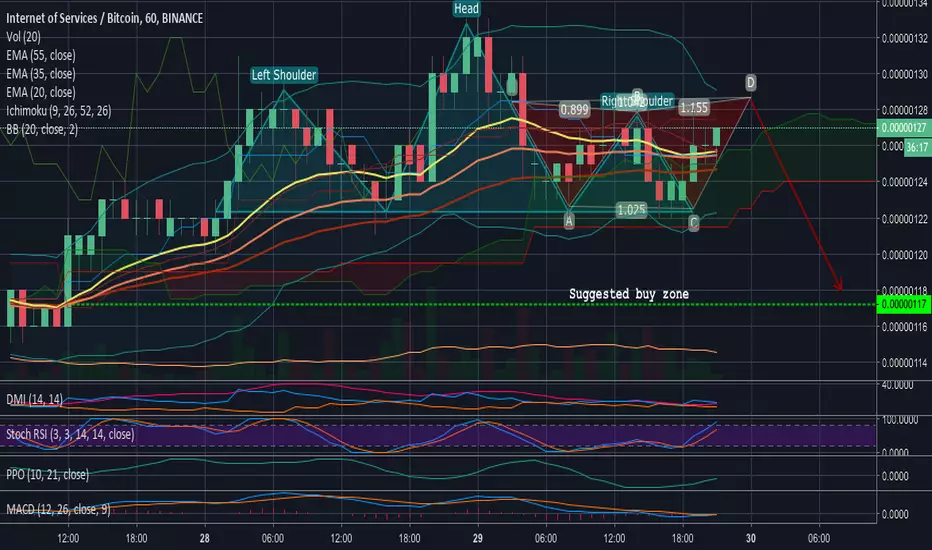
At the 1-hour timeframe chart it can be seen that a straight Head & Shoulders pattern has been formed and a half of bearish XABCD too.
Technical indicators are also bearish: Stoch RSI is going to hit overbought zone, while DMI shows low, while moving averages suggest a further reverse.
We recommend to fix profit from this bounce around 0.00000128 and rebuy again at 0.00000117
Technical indicators are also bearish: Stoch RSI is going to hit overbought zone, while DMI shows low, while moving averages suggest a further reverse.
We recommend to fix profit from this bounce around 0.00000128 and rebuy again at 0.00000117
Note
The price touched the buying zone we mentioned in the previous analysis and bounced. We expect a wave growth to our targets in the short termClaim up to 600 USDT in welcome rewards & compete for a share of 5,000 USDT in BitMart Futures Contest!
➡ Register & Claim Bonus: bitmart.com/invite/VShg8M
➡ Join Contest: bitmart.com/futures-competition/Skyrexio/en-US
➡ Register & Claim Bonus: bitmart.com/invite/VShg8M
➡ Join Contest: bitmart.com/futures-competition/Skyrexio/en-US
Disclaimer
The information and publications are not meant to be, and do not constitute, financial, investment, trading, or other types of advice or recommendations supplied or endorsed by TradingView. Read more in the Terms of Use.
Claim up to 600 USDT in welcome rewards & compete for a share of 5,000 USDT in BitMart Futures Contest!
➡ Register & Claim Bonus: bitmart.com/invite/VShg8M
➡ Join Contest: bitmart.com/futures-competition/Skyrexio/en-US
➡ Register & Claim Bonus: bitmart.com/invite/VShg8M
➡ Join Contest: bitmart.com/futures-competition/Skyrexio/en-US
Disclaimer
The information and publications are not meant to be, and do not constitute, financial, investment, trading, or other types of advice or recommendations supplied or endorsed by TradingView. Read more in the Terms of Use.