Long
IOSTBTC: Bottom is in?
Hello Fellow Traders,
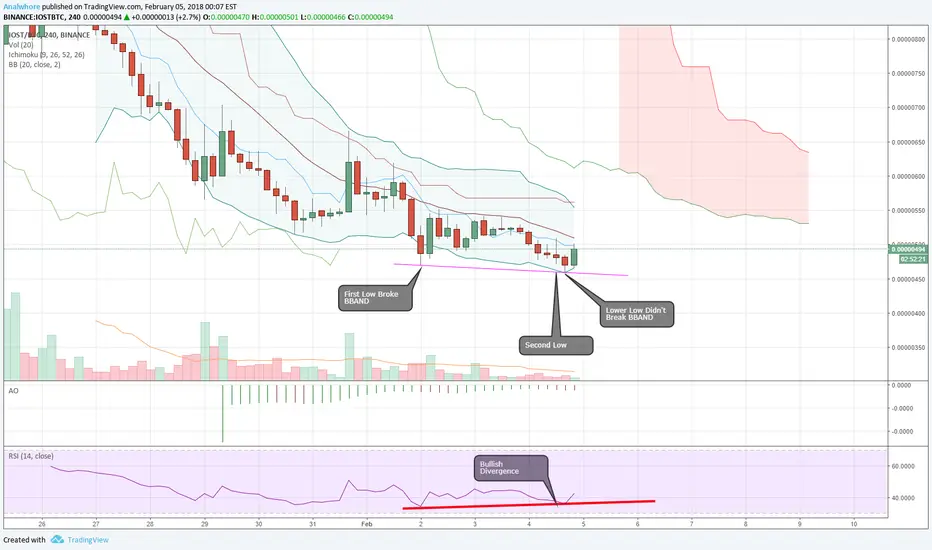
It looks like the bottom is in for IOST. There are a couple of indicators that hint to the bottom being locked in and we are going to go up from here.
1. There is bullish divergence on the RSI
2. There was a second low that didn't break the Bollinger Band for the W Double Bottom Pattern
Breakout is 541 Sats.
Good Luck.
Disclaimer
The information and publications are not meant to be, and do not constitute, financial, investment, trading, or other types of advice or recommendations supplied or endorsed by TradingView. Read more in the Terms of Use.
Disclaimer
The information and publications are not meant to be, and do not constitute, financial, investment, trading, or other types of advice or recommendations supplied or endorsed by TradingView. Read more in the Terms of Use.