Hello friends, please hit the LIKES to motivate these posts.
Between Mod duties and my own trades, it is not easy to publish.
This is an alert for a possible strong breakout about to take place.
If you have been following IOTA then you are very familiar with this "sad" story.
There have been many "news" events that spike and then fad away to a lower low.
This "could" be the bottom into breakout that we have all been waiting for patiently.
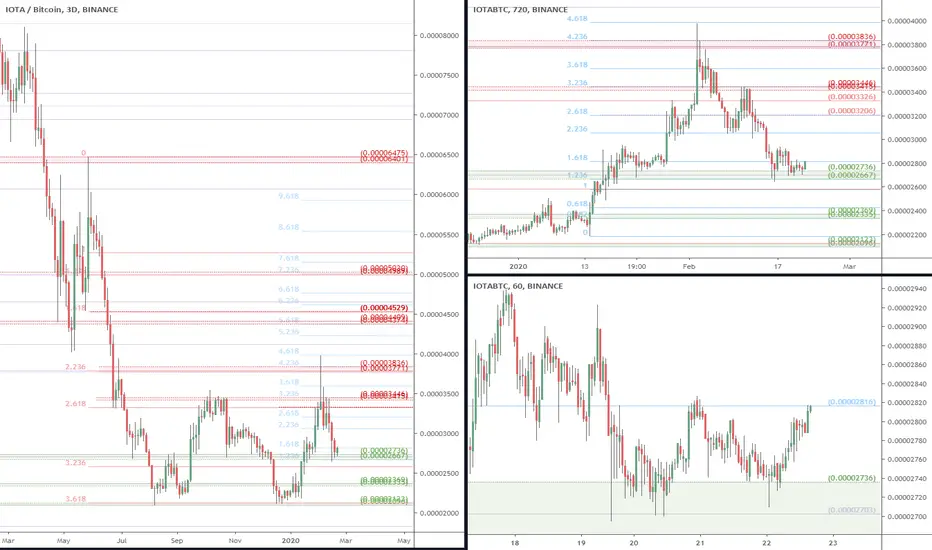
Currently sitting on strong support, visible to the naked eye without any fibs.
The last jump was a perfect 4.236 wave, currently fighting its 1.618 resistance.
The blue 1.236 of this fib is part of the current strong support zone that must hold.
It is too early to project Targets, other than existing resistance zones from high tf Fibs.
The last jump could turn out to be a "wave 1' of an 12345 Impulsive wave off the bottom.
If so, this wave could easily challenge recent highs around the 8100 sats peak last March.
2667-2736 sats is Key support that MUST hold, any lower and bullish view is lost.
3415-3446 sats will be first strong resistance, with minor fibs below that zone.
3771-3826 sats is the last strong resistance ahead of a wide open space to jump.
I will post UPDATES as price action progresses.
Follow this IDEA to be notified of updates in real time.
Follow ME to be notified of updates as well as new Ideas.
I plot many Coins, as well as Forex and some Stocks.
See my TV Profile Page for various such trade plans.
The way of the Fib is to show precise areas of concern.
Between Mod duties and my own trades, it is not easy to publish.
This is an alert for a possible strong breakout about to take place.
If you have been following IOTA then you are very familiar with this "sad" story.
There have been many "news" events that spike and then fad away to a lower low.
This "could" be the bottom into breakout that we have all been waiting for patiently.
Currently sitting on strong support, visible to the naked eye without any fibs.
The last jump was a perfect 4.236 wave, currently fighting its 1.618 resistance.
The blue 1.236 of this fib is part of the current strong support zone that must hold.
It is too early to project Targets, other than existing resistance zones from high tf Fibs.
The last jump could turn out to be a "wave 1' of an 12345 Impulsive wave off the bottom.
If so, this wave could easily challenge recent highs around the 8100 sats peak last March.
2667-2736 sats is Key support that MUST hold, any lower and bullish view is lost.
3415-3446 sats will be first strong resistance, with minor fibs below that zone.
3771-3826 sats is the last strong resistance ahead of a wide open space to jump.
I will post UPDATES as price action progresses.
Follow this IDEA to be notified of updates in real time.
Follow ME to be notified of updates as well as new Ideas.
I plot many Coins, as well as Forex and some Stocks.
See my TV Profile Page for various such trade plans.
The way of the Fib is to show precise areas of concern.
the Golden Ratio is my Religion
the Trading View is my Nation
the Moderator Tag is my Flag
the Trading View is my Nation
the Moderator Tag is my Flag
Disclaimer
The information and publications are not meant to be, and do not constitute, financial, investment, trading, or other types of advice or recommendations supplied or endorsed by TradingView. Read more in the Terms of Use.
Disclaimer
The information and publications are not meant to be, and do not constitute, financial, investment, trading, or other types of advice or recommendations supplied or endorsed by TradingView. Read more in the Terms of Use.