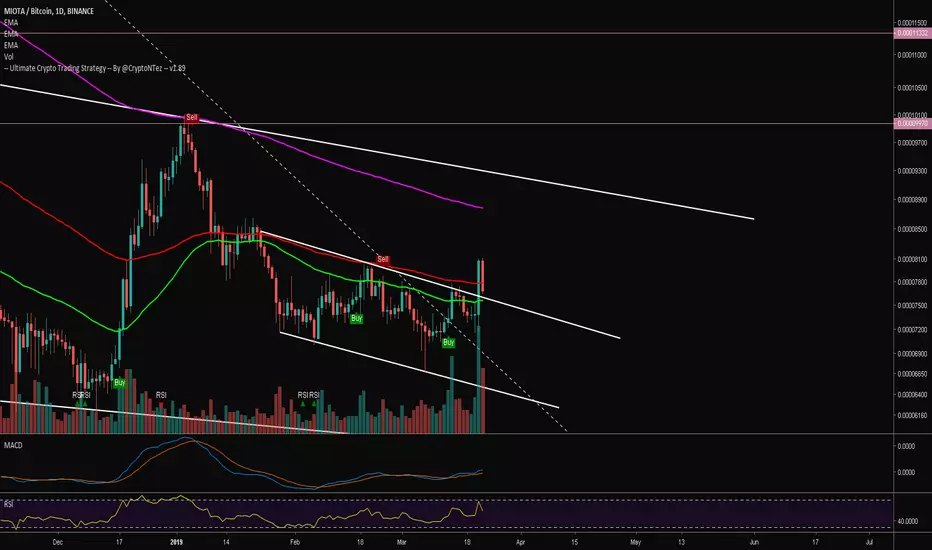
- UCTS showing buy signal on the 1D
- MACD & RSI looking good
- EMA50/100 acting as support
If EMA100 holds then we can expect price to reach EMA200/upper trendline of the chart #IOTA
UCTS Indicator? Get a 10 days FREE trial at Cryptontez.com
Improve your Crypto Trading with 3commas. 3commas.io/?c=Cryptontez
Telegram Group: t.me/CryptontezTA
Improve your Crypto Trading with 3commas. 3commas.io/?c=Cryptontez
Telegram Group: t.me/CryptontezTA
Disclaimer
The information and publications are not meant to be, and do not constitute, financial, investment, trading, or other types of advice or recommendations supplied or endorsed by TradingView. Read more in the Terms of Use.