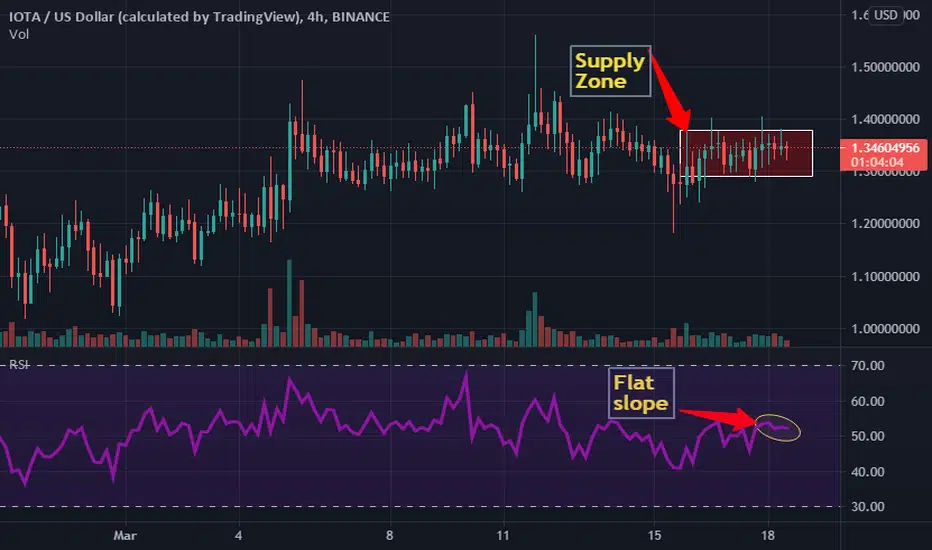
IOTA weekly chart shows consolidated move. The daily chart forecasts a possibility for a negative momentum in the price. While coming on to the shorter time frame of 4hrs, it is inside a supply zone. If the price breaks 10% above or below the zone, major movement can be seen on the IOTA price.
The volume indicator on the 4hr chart is at 516K, indicating a buying signal with lower strength. It can see a rise in buying if it goes above $1.5
Kindly Like And Follow Us
The volume indicator on the 4hr chart is at 516K, indicating a buying signal with lower strength. It can see a rise in buying if it goes above $1.5
Kindly Like And Follow Us
Related publications
Disclaimer
The information and publications are not meant to be, and do not constitute, financial, investment, trading, or other types of advice or recommendations supplied or endorsed by TradingView. Read more in the Terms of Use.
Related publications
Disclaimer
The information and publications are not meant to be, and do not constitute, financial, investment, trading, or other types of advice or recommendations supplied or endorsed by TradingView. Read more in the Terms of Use.