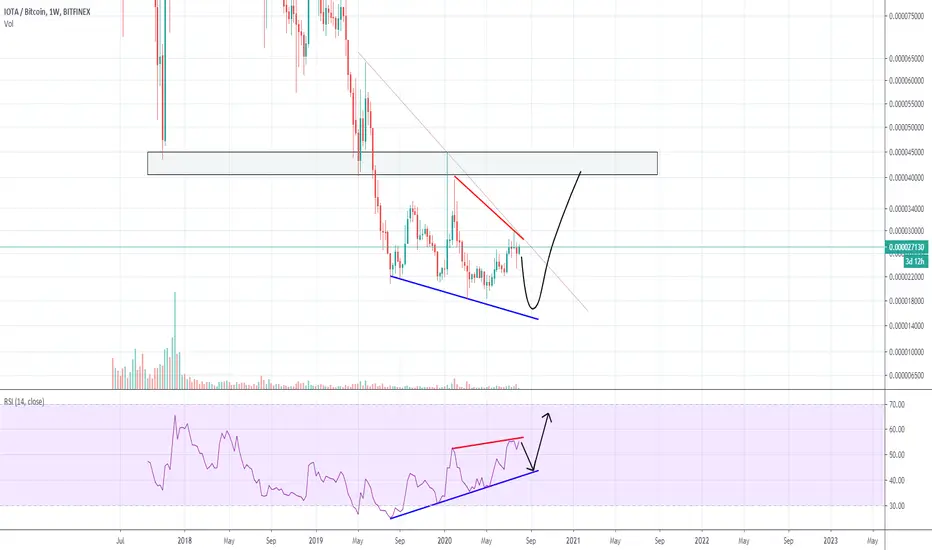
IOTBTC weekly chart looks interesting.
Bullish RSI divergence on weekly followed by a little bit smaller hidden bearish RSI divergence. So I would speculate that we will see a retracement to have it cleared, followed by a rally supported by that bullish RSI div.
42k sats seems like important resistance area I would be aiming there as target.
Disclaimer
The information and publications are not meant to be, and do not constitute, financial, investment, trading, or other types of advice or recommendations supplied or endorsed by TradingView. Read more in the Terms of Use.
Disclaimer
The information and publications are not meant to be, and do not constitute, financial, investment, trading, or other types of advice or recommendations supplied or endorsed by TradingView. Read more in the Terms of Use.