📈 IPCA Laboratories – Weekly Technical Analysis (For Study Purpose Only)
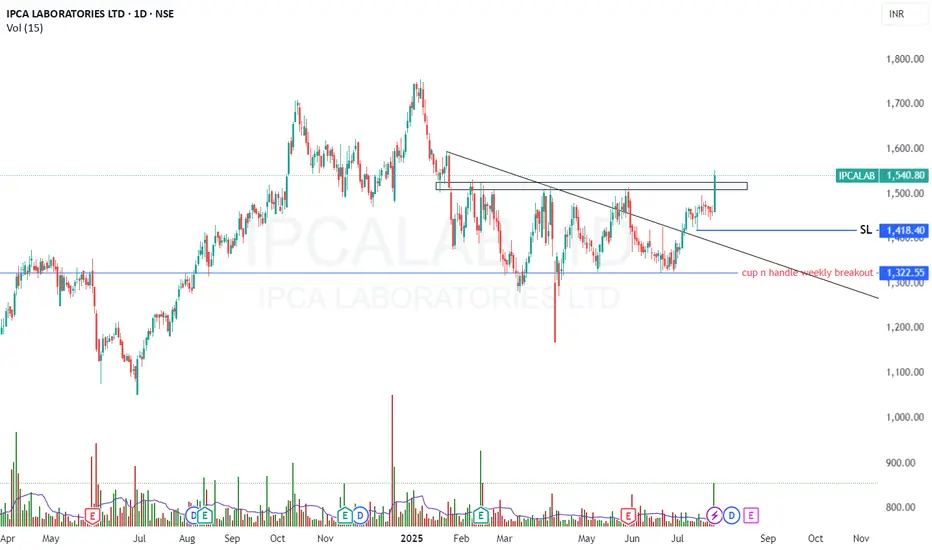
Ipca Labs has successfully completed a Cup and Handle breakout on the weekly chart, indicating a strong bullish setup after a prolonged consolidation phase.
After forming a double top and undergoing a nearly 6-month consolidation, the stock recently broke out above the neckline and range of ₹1320–₹1510, followed by a textbook retest of the breakout zone, which further strengthens the breakout's validity.
🔍 Key Technical Highlights:
✅ Pattern Formed: Weekly Cup and Handle retest and 6 month range breakout
📉 Previous Structure: Double top ➜ breakdown ➜ 6-month range consolidation
🔼 Breakout & Retest Zone: ₹1320–₹1510
✅ Retest Completed: Confirmed on weekly chart with supportive volume and price stability
🎯 Upside Targets:
Short-term: ₹1600
Medium-term: ₹1700
Long-term: New All-Time High (above ₹1750+)
🛑 Risk Management:
Stop-Loss: ₹1480 or (below retest zone)
📊 Supporting Indicators:
RSI trending upward, currently above 60 (bullish zone)
MACD crossover confirms positive momentum
Volume confirms strength during breakout
📌 Disclaimer: This analysis is for educational and study purposes only. Not a buy/sell recommendation.
Disclaimer
The information and publications are not meant to be, and do not constitute, financial, investment, trading, or other types of advice or recommendations supplied or endorsed by TradingView. Read more in the Terms of Use.
Disclaimer
The information and publications are not meant to be, and do not constitute, financial, investment, trading, or other types of advice or recommendations supplied or endorsed by TradingView. Read more in the Terms of Use.