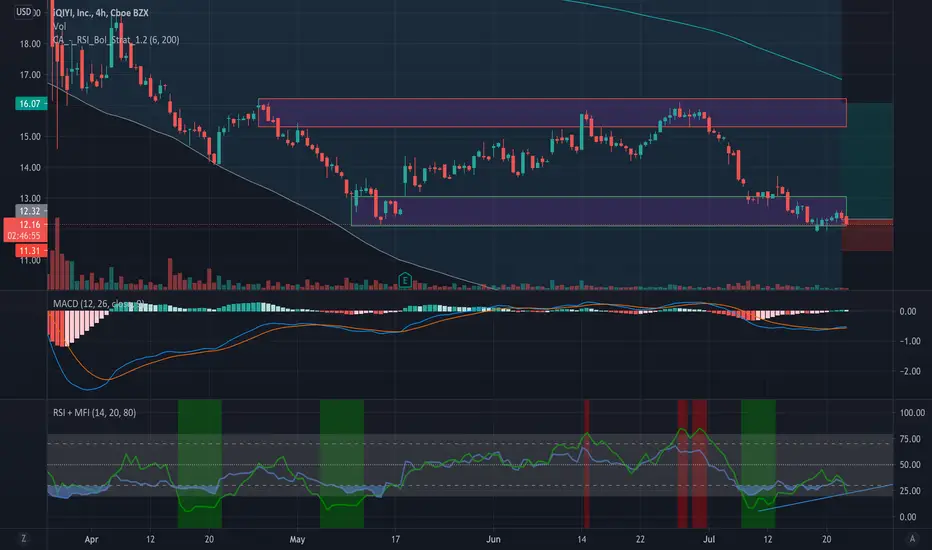
This looks way oversold, potential run up.
Technical Signs:
PT: $15-$16
Technical Signs:
- RSI/MFI: Bullish divergence compared to the last drop.
- Bollinger bands: At bottom end (on 4h), looks like a potential rip to the middle.
- Fibonacci: 23.6% is at the top end of the range.
PT: $15-$16
Disclaimer
The information and publications are not meant to be, and do not constitute, financial, investment, trading, or other types of advice or recommendations supplied or endorsed by TradingView. Read more in the Terms of Use.
Disclaimer
The information and publications are not meant to be, and do not constitute, financial, investment, trading, or other types of advice or recommendations supplied or endorsed by TradingView. Read more in the Terms of Use.