
Daily chart,
The stock
However, there is a strong Resistance line R, currently around 172.7
So, after stabilizing above 172.7 for 2 days, the target should be confirmed for a new entry (buy)
Consider a stop loss below 154, and raise the level along with the bullish movement.
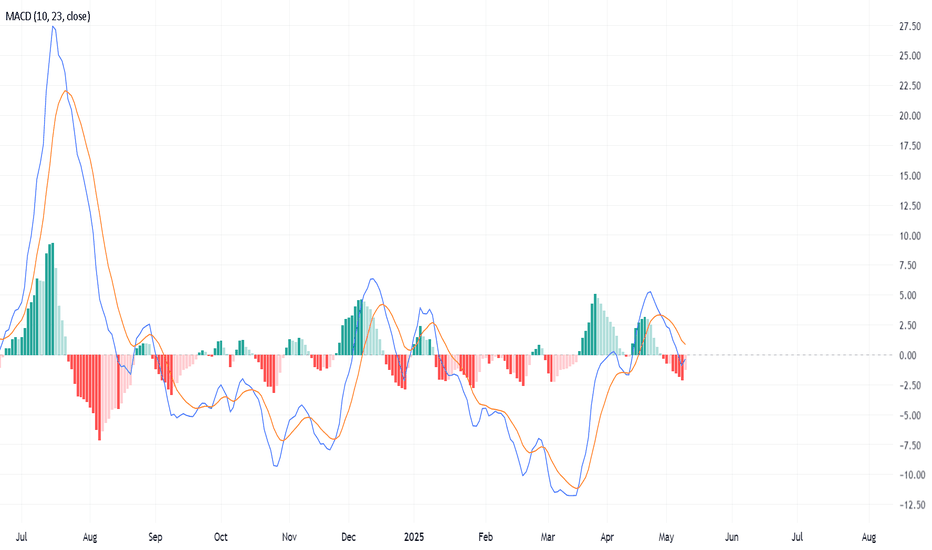
Technical indicators:
RSI is forming a bullish direction - positive
MACD is about to cross up the zero line - To be assertive after crossing both the zero line and its signal.
Trade active
tradingview.com/chart/MDK8RlXR/?symbol=NSE:IREDADisclaimer
The information and publications are not meant to be, and do not constitute, financial, investment, trading, or other types of advice or recommendations supplied or endorsed by TradingView. Read more in the Terms of Use.
Disclaimer
The information and publications are not meant to be, and do not constitute, financial, investment, trading, or other types of advice or recommendations supplied or endorsed by TradingView. Read more in the Terms of Use.