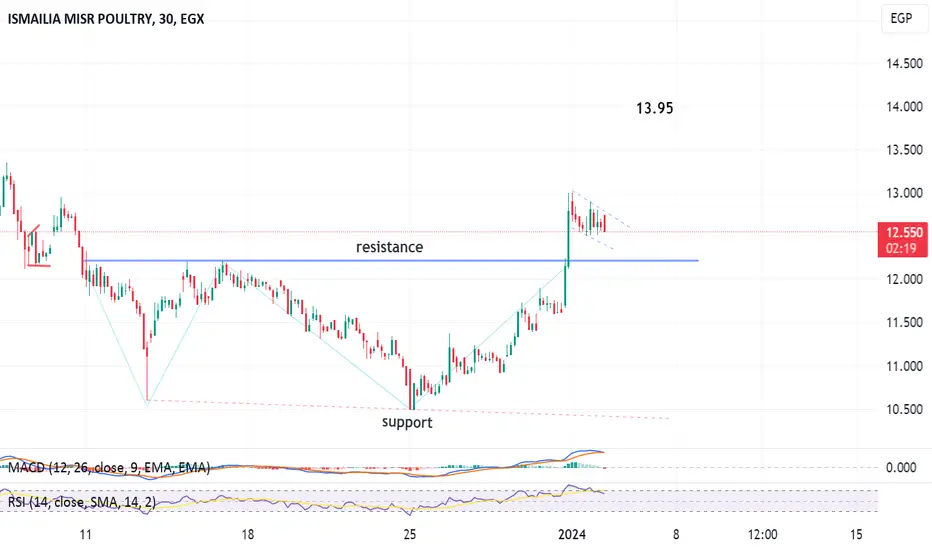
30-min, the stock formed W chart pattern, which targets 13.95
Note, the blue (resistance) line, turned into a support level after crossing up. So, consider a stop loss below it.
Note, the blue (resistance) line, turned into a support level after crossing up. So, consider a stop loss below it.
Trade active
It is healthy to have a price action and rebound at 12.2 This gives more power for reaching the target :)Trade active
still uptrendRelated publications
Disclaimer
The information and publications are not meant to be, and do not constitute, financial, investment, trading, or other types of advice or recommendations supplied or endorsed by TradingView. Read more in the Terms of Use.
Related publications
Disclaimer
The information and publications are not meant to be, and do not constitute, financial, investment, trading, or other types of advice or recommendations supplied or endorsed by TradingView. Read more in the Terms of Use.