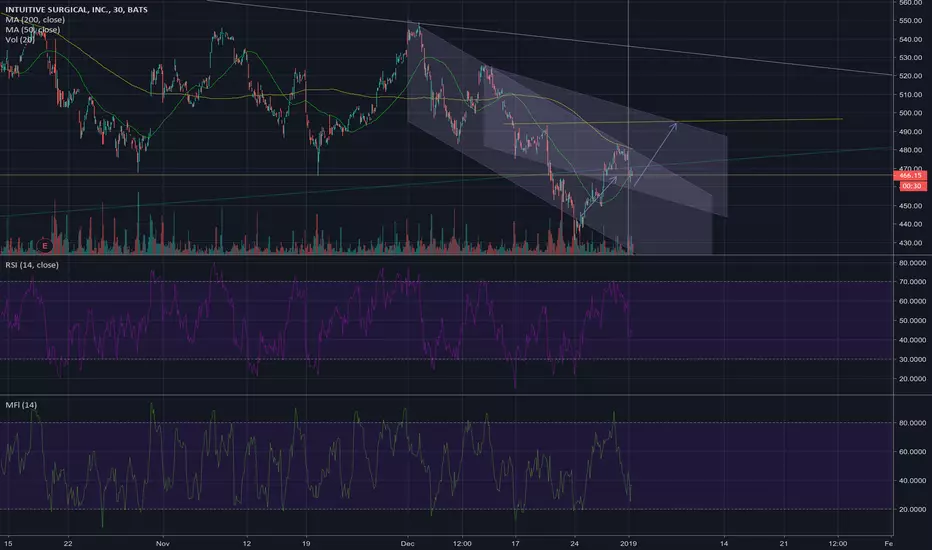
Check the chart and you'll see no less than 5 diff H&S patterns going both ways in the past several months... Expecting this one to play out as well. The yellow line is the daily 200DMA, expecting this to retest that before moving back down in a mid-late jan selloff as the broader market retests the xmas lows. Risk is definitely to the upside on this trade tho so tread carefully and bail if indices cannot break its downward trend from dec in the next several days.
Disclaimer
The information and publications are not meant to be, and do not constitute, financial, investment, trading, or other types of advice or recommendations supplied or endorsed by TradingView. Read more in the Terms of Use.
Disclaimer
The information and publications are not meant to be, and do not constitute, financial, investment, trading, or other types of advice or recommendations supplied or endorsed by TradingView. Read more in the Terms of Use.