On the Weekly chart I see excellent price divergence to the MACD indicator

On the daily chart there is also an excellent price divergence towards the indicator.

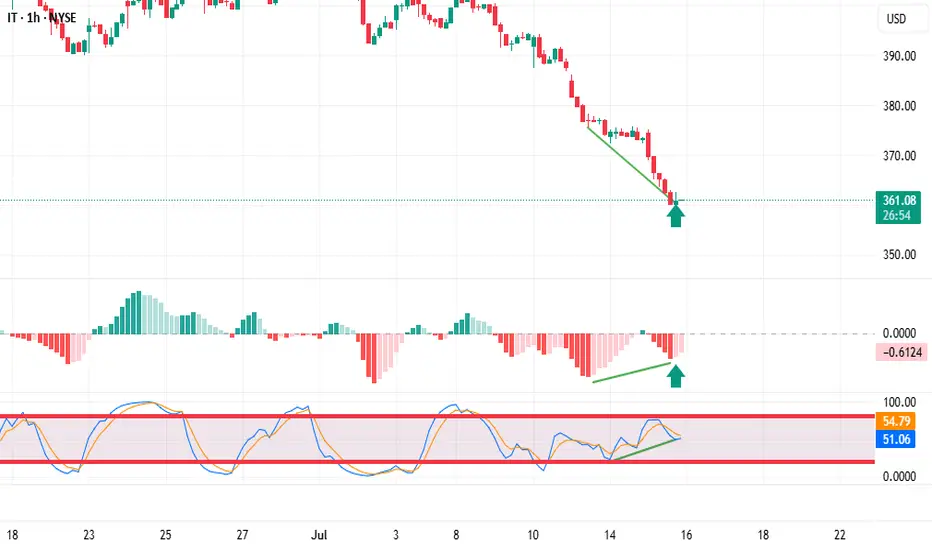
The hourly chart confirms the analysis; there is also a price divergence to the indicator.

The signal for me to enter a trade is that the histogram has stopped decreasing and changed the color of the bar from red to light pink
I placed a pending order above the bar marked with an arrow, and a stop loss below it.
 IT
IT
On the daily chart there is also an excellent price divergence towards the indicator.
The hourly chart confirms the analysis; there is also a price divergence to the indicator.
The signal for me to enter a trade is that the histogram has stopped decreasing and changed the color of the bar from red to light pink
I placed a pending order above the bar marked with an arrow, and a stop loss below it.
Note
The price did not activate my buy order above the previous candle. Moved a buy order above the current barTrade active
Disclaimer
The information and publications are not meant to be, and do not constitute, financial, investment, trading, or other types of advice or recommendations supplied or endorsed by TradingView. Read more in the Terms of Use.
Disclaimer
The information and publications are not meant to be, and do not constitute, financial, investment, trading, or other types of advice or recommendations supplied or endorsed by TradingView. Read more in the Terms of Use.