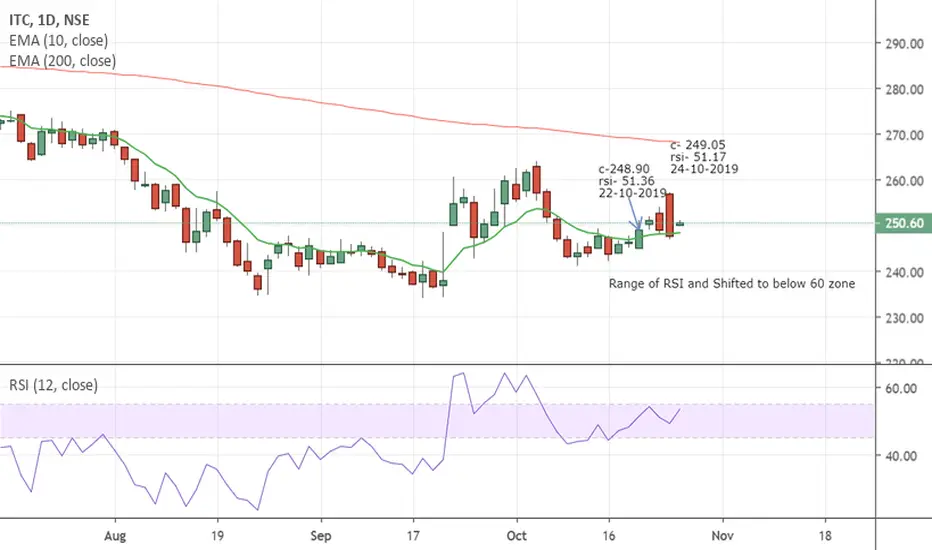
ITC seems to be making a bearish divergence. As indicated in the graph
at the reference Bar following data emerges.
c-248.90
rsi- 51.36
22-10-2019
Now our comparative bar poses below picture:
c- 249.05
rsi- 51.17
24-10-2019
Thus we can clearly see that despite the Closing price being higher there has been a lower rsi. Looking to achieve target of 236 within one week time.
Note
SL hit. Trade Closed.Disclaimer
The information and publications are not meant to be, and do not constitute, financial, investment, trading, or other types of advice or recommendations supplied or endorsed by TradingView. Read more in the Terms of Use.
Disclaimer
The information and publications are not meant to be, and do not constitute, financial, investment, trading, or other types of advice or recommendations supplied or endorsed by TradingView. Read more in the Terms of Use.