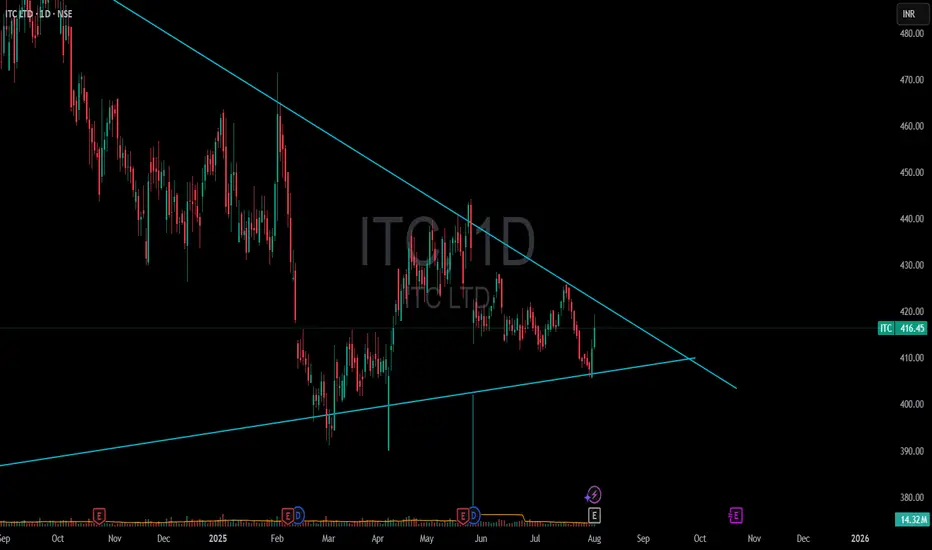
🔺 Triangle Pattern (likely Symmetrical/Ascending Triangle)
Current Price Zone: ₹416
Pattern Type: Likely Ascending Triangle (if higher lows are forming against a horizontal resistance)
Resistance Level: Around ₹416–420
Breakout Confirmation: Needs a strong bullish candle above resistance with significant volume.
📊 What to Watch:
Volume:
A genuine breakout should happen with above-average volume. Watch the 50-period or 20-period average volumes on daily or 1H chart.
Breakout Candle:
Should close above ₹420 ideally. A breakout without closing above resistance is risky.
Retest Possibility:
Sometimes, price may break out and retest the breakout level before continuing the uptrend. Don’t panic if it slightly dips and holds support near ₹416.
🎯 Target Levels After Breakout:
You can calculate the triangle breakout target like this:
Target = Height of triangle + Breakout point
Let’s assume the base of triangle is from ₹375 to ₹416 = ₹41 range
Breakout Target = ₹416 + ₹41 = ₹457
📌 Extended Target (Momentum-based): ₹475–₹500 zone
📌 If volumes + broader market support: ₹500+ is possible, especially in swing or positional setups.
📉 Invalidation (Risk Management):
If after breakout, price falls below ₹410–408 with volume, it could be a false breakout.
Keep a stop-loss below previous swing lows or support trendline.
🧠 Summary:
✅ Triangle breakout with volume = bullish confirmation
🎯 Targets: ₹457 → ₹475 → ₹500
❗ Risk zone: below ₹410
🔁 Retest is common before upmove continues
Disclaimer: The information provided is for educational and informational purposes only and should not be considered as financial advice. Investing in the stock market involves risk, and past performance is not indicative of future results. Please consult with a certified financial advisor or conduct your own research before making any investment decisions. We are not responsible for any losses incurred as a result of using this information. Stock market investments are subject to market risks; read all related documents carefully.
Disclaimer
The information and publications are not meant to be, and do not constitute, financial, investment, trading, or other types of advice or recommendations supplied or endorsed by TradingView. Read more in the Terms of Use.
Disclaimer
The information and publications are not meant to be, and do not constitute, financial, investment, trading, or other types of advice or recommendations supplied or endorsed by TradingView. Read more in the Terms of Use.