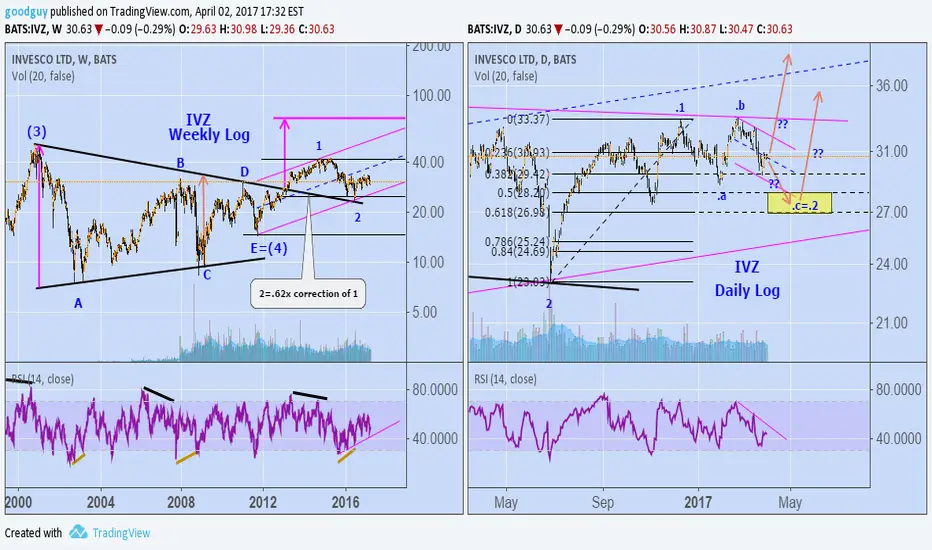
When a long term down trend line (weekly chart) is broken and returned to and provides support (weekly chart at "2" it can be a sign of positive things to come. Point 2 is near the start of the daily chart. Just looking at the chart pattern on the daily chart I favor there may be one more down move before the correction ".2" is over. Maybe not. Personally I am waiting to see. If it does could provide a good buying opportunity. Long term target around 70.
I am in to charting not fundamentals. But Goldman recently upgraded this to buy. Ford Equity Research calls it a strong buy. So some folks smarter than myself financially think there is something positive going on.
Take care. Process your way.
I am in to charting not fundamentals. But Goldman recently upgraded this to buy. Ford Equity Research calls it a strong buy. So some folks smarter than myself financially think there is something positive going on.
Take care. Process your way.
Disclaimer
The information and publications are not meant to be, and do not constitute, financial, investment, trading, or other types of advice or recommendations supplied or endorsed by TradingView. Read more in the Terms of Use.
Disclaimer
The information and publications are not meant to be, and do not constitute, financial, investment, trading, or other types of advice or recommendations supplied or endorsed by TradingView. Read more in the Terms of Use.