Market Structure Analysis:
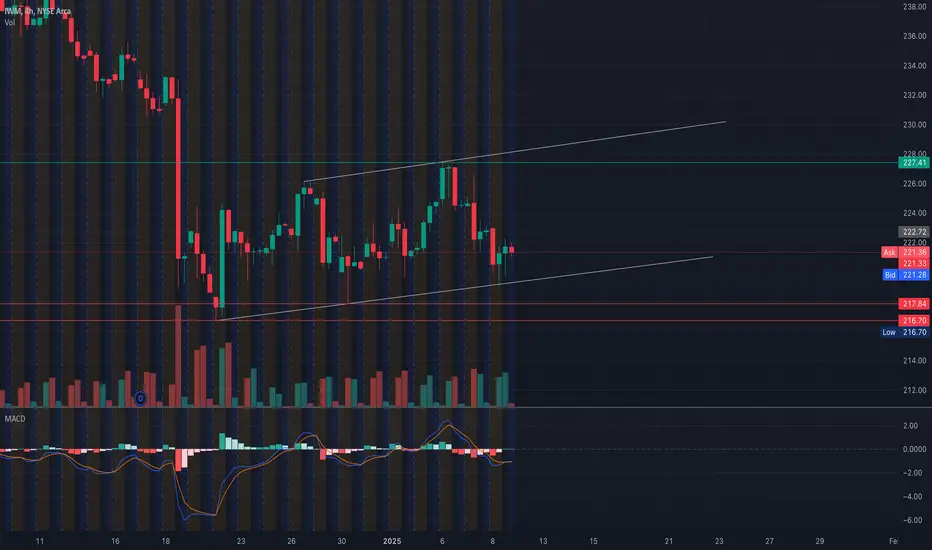
* Current Trend: IWM shows a short-term ascending wedge pattern on the 4-hour chart, indicating a consolidation phase with upward bias.
* Support Levels:
* Key Support at $221.36: Significant level backed by Gamma Exposure (GEX) analysis indicating strong PUT activity.
* Critical Support at $217.84 and $216.70: These levels provide additional safety nets in case of a bearish breakdown.
* Resistance Levels:
* Immediate Resistance at $223: Corresponds to CALL wall activities with notable Gamma Resistance.
* Major Resistance at $227.41: An inflection zone coinciding with recent highs and GEX analysis.
Key Gamma Levels:

* Gamma Resistance:
* $223 (39.39% CALL Resistance): Expected to act as an immediate resistance.
* $227 (8.91% 2nd CALL Wall): A crucial level, challenging further bullish movement.
* Gamma Support:
* $221.36 (Highest Negative NETGEX PUT Support): This is the most substantial support level, critical for holding bullish sentiment.
Technical Indicators:
* MACD: Flattening near zero, suggesting potential sideways movement or preparation for a breakout.
* Volume Profile: Diminishing volume in the consolidation zone, often preceding a significant move.
Trade Scenarios:
1. Bullish Case:
* Entry: Above $223 with increased volume.
* Target: $227 (1st target) and $230 (2nd target).
* Stop-Loss: Below $221.36.
2. Bearish Case:
* Entry: Below $221.
* Target: $217.84 (1st target) and $216.70 (2nd target).
* Stop-Loss: Above $223.
Outlook:
* Consolidation within the wedge suggests indecision; the breakout direction will set the tone for IWM in the short term.
* High Gamma activity around $223 and $221 implies that these levels are pivotal for the upcoming price action.
Disclaimer: This analysis is for educational purposes only and should not be considered financial advice. Always conduct your own research and manage risk responsibly before trading.
* Current Trend: IWM shows a short-term ascending wedge pattern on the 4-hour chart, indicating a consolidation phase with upward bias.
* Support Levels:
* Key Support at $221.36: Significant level backed by Gamma Exposure (GEX) analysis indicating strong PUT activity.
* Critical Support at $217.84 and $216.70: These levels provide additional safety nets in case of a bearish breakdown.
* Resistance Levels:
* Immediate Resistance at $223: Corresponds to CALL wall activities with notable Gamma Resistance.
* Major Resistance at $227.41: An inflection zone coinciding with recent highs and GEX analysis.
Key Gamma Levels:
* Gamma Resistance:
* $223 (39.39% CALL Resistance): Expected to act as an immediate resistance.
* $227 (8.91% 2nd CALL Wall): A crucial level, challenging further bullish movement.
* Gamma Support:
* $221.36 (Highest Negative NETGEX PUT Support): This is the most substantial support level, critical for holding bullish sentiment.
Technical Indicators:
* MACD: Flattening near zero, suggesting potential sideways movement or preparation for a breakout.
* Volume Profile: Diminishing volume in the consolidation zone, often preceding a significant move.
Trade Scenarios:
1. Bullish Case:
* Entry: Above $223 with increased volume.
* Target: $227 (1st target) and $230 (2nd target).
* Stop-Loss: Below $221.36.
2. Bearish Case:
* Entry: Below $221.
* Target: $217.84 (1st target) and $216.70 (2nd target).
* Stop-Loss: Above $223.
Outlook:
* Consolidation within the wedge suggests indecision; the breakout direction will set the tone for IWM in the short term.
* High Gamma activity around $223 and $221 implies that these levels are pivotal for the upcoming price action.
Disclaimer: This analysis is for educational purposes only and should not be considered financial advice. Always conduct your own research and manage risk responsibly before trading.
Disclaimer
The information and publications are not meant to be, and do not constitute, financial, investment, trading, or other types of advice or recommendations supplied or endorsed by TradingView. Read more in the Terms of Use.
Disclaimer
The information and publications are not meant to be, and do not constitute, financial, investment, trading, or other types of advice or recommendations supplied or endorsed by TradingView. Read more in the Terms of Use.