Volatility, expressed through standard deviation, quantifies market elasticity and presents a level of probability and precision that humbles us all.
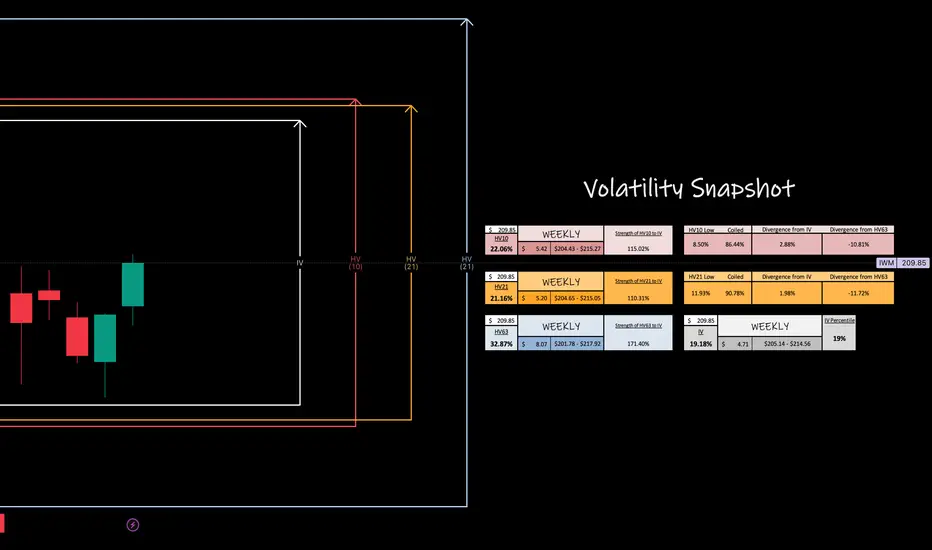
This week with IWM you can see that last week trending bi-weekly markets were more volatile than our monthly trending values. This could indicate regression to quarterly means, but for now shows a 15.02% premium advantage over current IV per move.
Bi-weekly, is as of now, only 10.81% off it's quarterly trend. However, it's important to observe that volatility can still consolidate under monthly in a poetic dance to coil up the monthly more on it's path in regression.
This is why in my charts you will notice a 'coiling' value under both HV10 and HV21 values.
BOOST the post, drop a follow and comment, BUT don't forget to circle back at the end of the week to revisit and observe how our trending markets preformed!
This week with
Bi-weekly, is as of now, only 10.81% off it's quarterly trend. However, it's important to observe that volatility can still consolidate under monthly in a poetic dance to coil up the monthly more on it's path in regression.
This is why in my charts you will notice a 'coiling' value under both HV10 and HV21 values.
BOOST the post, drop a follow and comment, BUT don't forget to circle back at the end of the week to revisit and observe how our trending markets preformed!
Trade closed manually
What an interesting week in small caps! Drilling PA where volatility expanded to the quarterly trending means. Beautiful regression.Dive deeper into the world of volatility with me — Post a comment, ask a question, and BOOST the post if you’d like.
Make sure you 'Grab my Chart' weekly to pull my data onto your screen!
Find me over on the 'X' platform:
@askHVtobidIV
Make sure you 'Grab my Chart' weekly to pull my data onto your screen!
Find me over on the 'X' platform:
@askHVtobidIV
Related publications
Disclaimer
The information and publications are not meant to be, and do not constitute, financial, investment, trading, or other types of advice or recommendations supplied or endorsed by TradingView. Read more in the Terms of Use.
Dive deeper into the world of volatility with me — Post a comment, ask a question, and BOOST the post if you’d like.
Make sure you 'Grab my Chart' weekly to pull my data onto your screen!
Find me over on the 'X' platform:
@askHVtobidIV
Make sure you 'Grab my Chart' weekly to pull my data onto your screen!
Find me over on the 'X' platform:
@askHVtobidIV
Related publications
Disclaimer
The information and publications are not meant to be, and do not constitute, financial, investment, trading, or other types of advice or recommendations supplied or endorsed by TradingView. Read more in the Terms of Use.