I am using 30 and 5 min charts for my trade entry, but here is my context for the trade:
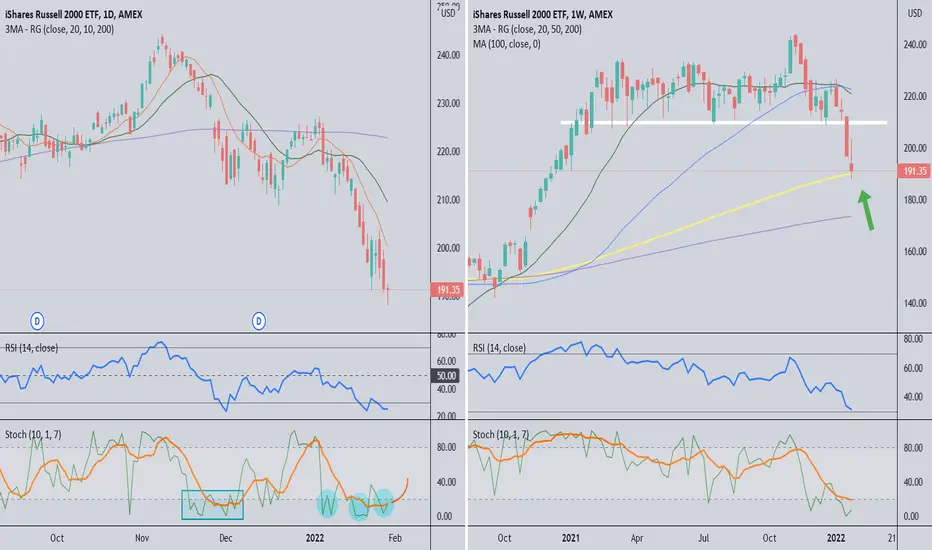
Daily chart:
> stochastic shows 3 %K dips below 20, and usually the third one happens as %D starts turning up. Rarely are there more than 3 dips, and you can see the same in Nov-Dec (rectangle). Think of it as a 5-wave move (3 dips, 2 rises) that then
> will have to wait for close to see if RSI makes a bullish divergence between today and 21 Jan.
Weekly chart:
> Though used less often, the 100ma (yellow) provides support for a bounce
> Price can move up to 198, and maybe the resistance at 208-210, which matches the daily 20ma
Trade active
I waited for the pull back when IWM pulled back to 191. Bought 18Feb 196 calls for $4.13Trade closed manually
Been busy - I am not convince of the relief rally yet, taking a hard look across 30m and daily timeframes on multiple stocks. Sold the calls for $4.35.Trade active
My apologies,, I forgot to mention my other trade.I like this drop in the afternoon if markets rise into close. I bought 18Feb 198 calls for $3.00.
Trade closed manually
Wow did markets rise into close on Friday! I sold my calls this morning for $4.82 and $5.19. IWM may go higher but since a lower VIX and theta work against my long calls I chose to exit. I can always buy again.Disclaimer
The information and publications are not meant to be, and do not constitute, financial, investment, trading, or other types of advice or recommendations supplied or endorsed by TradingView. Read more in the Terms of Use.
Disclaimer
The information and publications are not meant to be, and do not constitute, financial, investment, trading, or other types of advice or recommendations supplied or endorsed by TradingView. Read more in the Terms of Use.