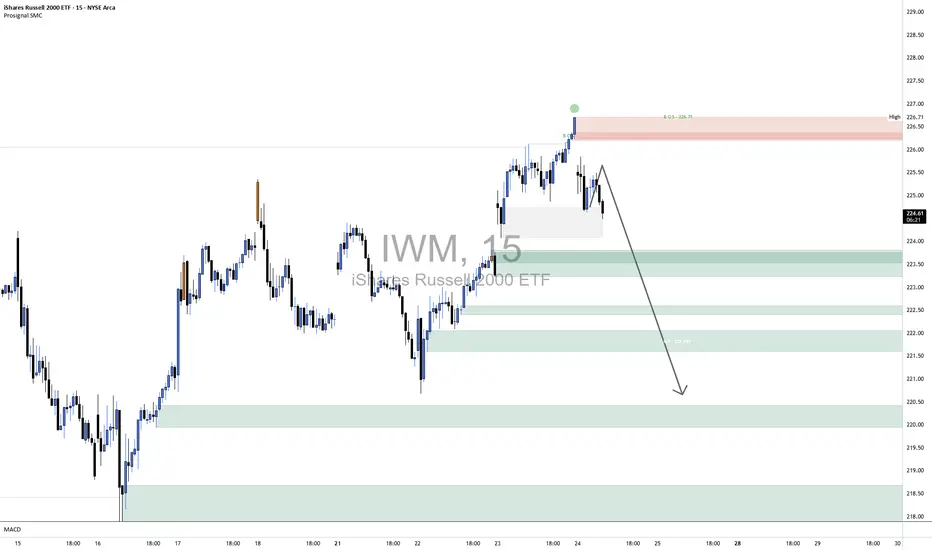
1. Broader Market Structure 📉
1.1 Change of Character (CHoCH)
Occurred near the top (~226.70), breaking the prior higher low—signaling a shift from bullish to bearish momentum.
1.2 Break of Structure (BOS)
Confirmed by a move below that level, validating the bearish change and underlining a downtrend in progress.
2. Supply & Demand Zones
2.1 Demand Zones (Support)
Price zones where buyers have previously stepped in, marking potential reversal points:
Zone A (~223.00–223.50) – First layer of support; price tested this zone after the BOS.
Zone B (~221.80–222.20) – Mid-range demand area with historical buyer activity.
Zone C (~220.00–220.50) – Deeper support zone; last line before structural lows.
Key Takeaway: These zones represent probable stops for a short-term pullback and are ideal for long-entry decisions.
2.2 Supply Zone (Resistance)
~226.70–226.75 – Located at the level where BOS occurred; acts as near-term resistance where sellers may reassert control.
3. Price Action Inside the Bordered Area
Current Price (~224.55): Hovering between the supply and first demand zone.
Expected Movement:
A pullback into Zone A (~223.00–223.50).
If demand holds, look for a bullish reaction—forming a higher low, potentially pushing price back toward 226.70+.
Bearish Risk: A break below Zone A increases downside risk into Zone B or C, reinforcing the bearish structure.
4. Momentum & Structure Outlook
Bullish Scenario: A bounce from demand with structure preserved (~higher low) could lead to short-term upside into resistance.
Bearish Scenario: A drop below the bordered demand zone would confirm continuation of the downtrend.
Watch: Price structure around the 224–223 area and reversal cues (e.g., rejection candles, volume spikes).
Looking for powerful AI trading signals? Visit ProSignal.ai and take your trading to the next level! or join our telegram channel at t.me/prosignalai
Disclaimer
The information and publications are not meant to be, and do not constitute, financial, investment, trading, or other types of advice or recommendations supplied or endorsed by TradingView. Read more in the Terms of Use.