📈 IWM Technical Outlook – Wedge Break Imminent
Ticker: IWM (Russell 2000 ETF)
Timeframe: 30-minute candles
🔍 Current Setup
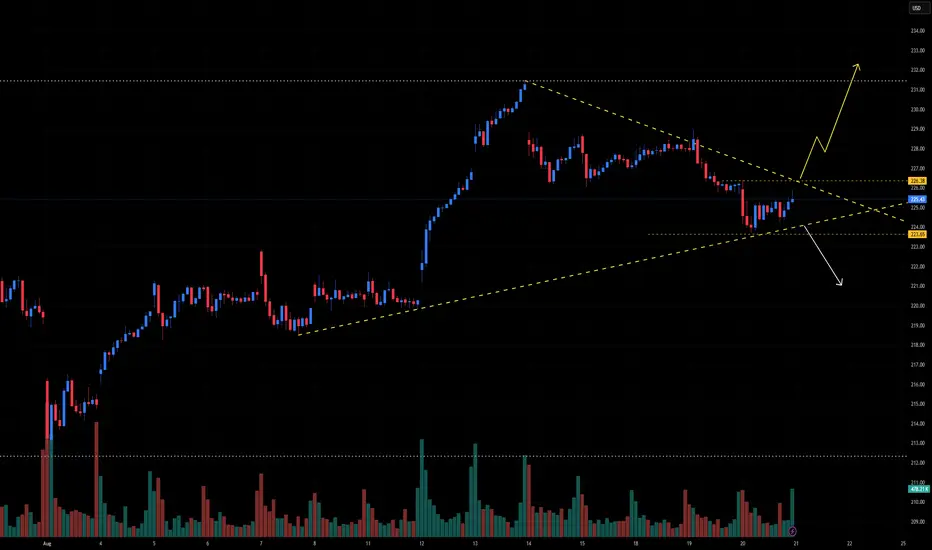
IWM has formed a symmetrical wedge, with price compressing between a descending resistance line (~227) and an ascending support line (~223.65). This pattern reflects a balance of buyers and sellers — and it’s nearing its apex, signaling that a decisive breakout is likely very soon.
📊 Breakout Levels
🚀 Upside (Bullish Scenario)
Trigger: Close above 227.00 with volume
Intermediate Targets:
231.50–232.00 → Prior swing high resistance
235.00–236.00 → Momentum continuation zone
Measured Move Target: 237.00
🔻 Downside (Bearish Scenario)
Trigger: Close below 223.65 with volume
Intermediate Supports:
221.00 → Local demand area
217.00 → Previous consolidation base
Measured Move Target: 213.50
📈 Volume Analysis
Recent candles show a pickup in volume, a classic sign that markets are preparing for a strong move.
Whichever side breaks first is likely to carry momentum, with follow-through expected.
⚖️ Probability Bias
Current price action suggests buyers are defending the rising trendline, but momentum has slowed since the last rally.
A strong close above 227 would put bulls firmly in control.
Conversely, failure to hold 223.65 opens the door for a deeper correction.
✅ Takeaway
The wedge is tight, and the breakout is imminent:
Bullish Break > 227: Look for 231.50 → 235 → 237
Bearish Break < 223.65: Look for 221 → 217 → 213.50
Stay alert — volume will confirm the true direction.
Ticker: IWM (Russell 2000 ETF)
Timeframe: 30-minute candles
🔍 Current Setup
IWM has formed a symmetrical wedge, with price compressing between a descending resistance line (~227) and an ascending support line (~223.65). This pattern reflects a balance of buyers and sellers — and it’s nearing its apex, signaling that a decisive breakout is likely very soon.
📊 Breakout Levels
🚀 Upside (Bullish Scenario)
Trigger: Close above 227.00 with volume
Intermediate Targets:
231.50–232.00 → Prior swing high resistance
235.00–236.00 → Momentum continuation zone
Measured Move Target: 237.00
🔻 Downside (Bearish Scenario)
Trigger: Close below 223.65 with volume
Intermediate Supports:
221.00 → Local demand area
217.00 → Previous consolidation base
Measured Move Target: 213.50
📈 Volume Analysis
Recent candles show a pickup in volume, a classic sign that markets are preparing for a strong move.
Whichever side breaks first is likely to carry momentum, with follow-through expected.
⚖️ Probability Bias
Current price action suggests buyers are defending the rising trendline, but momentum has slowed since the last rally.
A strong close above 227 would put bulls firmly in control.
Conversely, failure to hold 223.65 opens the door for a deeper correction.
✅ Takeaway
The wedge is tight, and the breakout is imminent:
Bullish Break > 227: Look for 231.50 → 235 → 237
Bearish Break < 223.65: Look for 221 → 217 → 213.50
Stay alert — volume will confirm the true direction.
Disclaimer
The information and publications are not meant to be, and do not constitute, financial, investment, trading, or other types of advice or recommendations supplied or endorsed by TradingView. Read more in the Terms of Use.
Disclaimer
The information and publications are not meant to be, and do not constitute, financial, investment, trading, or other types of advice or recommendations supplied or endorsed by TradingView. Read more in the Terms of Use.