Analysis:
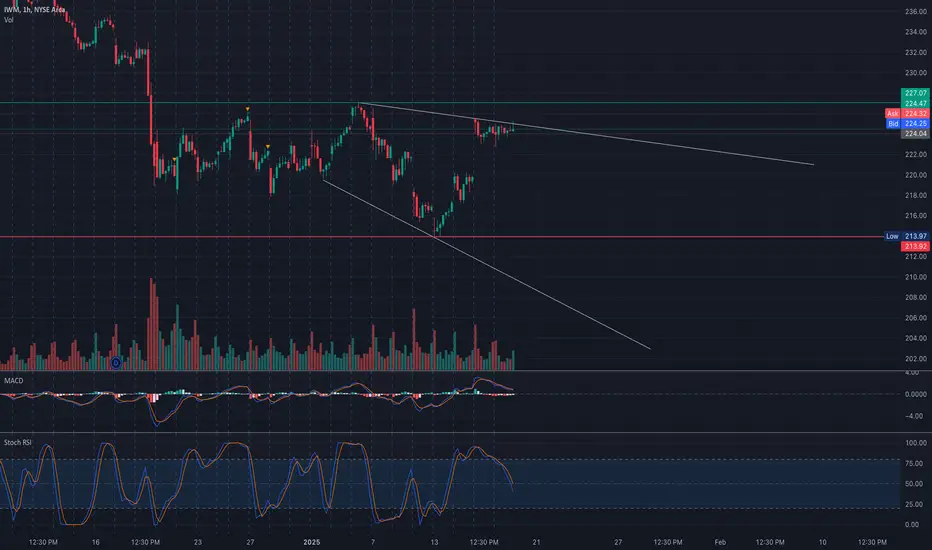
IWM is consolidating within a narrowing wedge pattern near the $224-$225 resistance zone. The stock is showing signs of a potential breakout or breakdown as it approaches the apex of the wedge. The MACD is neutral but trending slightly bearish, while the Stochastic RSI is in the mid-range, suggesting indecision among buyers and sellers.
Volume has been steady, with resistance near $227 and strong support at $222. A break above or below these levels will likely dictate the next directional move.
Key Levels to Watch:
* Resistance Levels:
* $225-$227: Strong resistance zone, aligning with the second call wall and positive GEX levels.
* $228: Extended resistance target.
* Support Levels:
* $223: Immediate support near the wedge’s lower trendline.
* $222: Key support level aligned with the highest negative GEX.
* $220: Extended downside support.
GEX Insights:

* Gamma Exposure (GEX):
* Positive GEX peaks at $227-$228, indicating significant overhead resistance.
* Negative GEX levels at $222-$220 provide critical support and signal increased volatility if breached.
* Options Activity:
* IVR: Low at 17, reflecting reduced implied volatility.
* Put/Call Ratio: Low put activity at 3.3%, indicating bullish sentiment is stronger.
Trade Scenarios:
Bullish Scenario:
* Entry: Break above $225 with strong volume.
* Target: $227 (first target), $228 (extended target).
* Stop-Loss: Below $223.
Bearish Scenario:
* Entry: Break below $223 with increasing selling pressure.
* Target: $222 (first target), $220 (extended target).
* Stop-Loss: Above $225.
Directional Bias:
Neutral bias as IWM remains within the wedge pattern. A breakout above $225 or a breakdown below $223 will confirm the next directional move.
Actionable Suggestions:
* For Scalpers: Focus on quick trades near $223-$225, watching for volume surges.
* For Swing Traders: Look for a confirmed breakout or breakdown from the wedge pattern before committing to a position.
Disclaimer: This analysis is for educational purposes only and does not constitute financial advice. Always do your own research and manage your risk before trading.
IWM is consolidating within a narrowing wedge pattern near the $224-$225 resistance zone. The stock is showing signs of a potential breakout or breakdown as it approaches the apex of the wedge. The MACD is neutral but trending slightly bearish, while the Stochastic RSI is in the mid-range, suggesting indecision among buyers and sellers.
Volume has been steady, with resistance near $227 and strong support at $222. A break above or below these levels will likely dictate the next directional move.
Key Levels to Watch:
* Resistance Levels:
* $225-$227: Strong resistance zone, aligning with the second call wall and positive GEX levels.
* $228: Extended resistance target.
* Support Levels:
* $223: Immediate support near the wedge’s lower trendline.
* $222: Key support level aligned with the highest negative GEX.
* $220: Extended downside support.
GEX Insights:
* Gamma Exposure (GEX):
* Positive GEX peaks at $227-$228, indicating significant overhead resistance.
* Negative GEX levels at $222-$220 provide critical support and signal increased volatility if breached.
* Options Activity:
* IVR: Low at 17, reflecting reduced implied volatility.
* Put/Call Ratio: Low put activity at 3.3%, indicating bullish sentiment is stronger.
Trade Scenarios:
Bullish Scenario:
* Entry: Break above $225 with strong volume.
* Target: $227 (first target), $228 (extended target).
* Stop-Loss: Below $223.
Bearish Scenario:
* Entry: Break below $223 with increasing selling pressure.
* Target: $222 (first target), $220 (extended target).
* Stop-Loss: Above $225.
Directional Bias:
Neutral bias as IWM remains within the wedge pattern. A breakout above $225 or a breakdown below $223 will confirm the next directional move.
Actionable Suggestions:
* For Scalpers: Focus on quick trades near $223-$225, watching for volume surges.
* For Swing Traders: Look for a confirmed breakout or breakdown from the wedge pattern before committing to a position.
Disclaimer: This analysis is for educational purposes only and does not constitute financial advice. Always do your own research and manage your risk before trading.
Disclaimer
The information and publications are not meant to be, and do not constitute, financial, investment, trading, or other types of advice or recommendations supplied or endorsed by TradingView. Read more in the Terms of Use.
Disclaimer
The information and publications are not meant to be, and do not constitute, financial, investment, trading, or other types of advice or recommendations supplied or endorsed by TradingView. Read more in the Terms of Use.