QQQ Pre-Market Analysis – April 25, 2025
General Context:
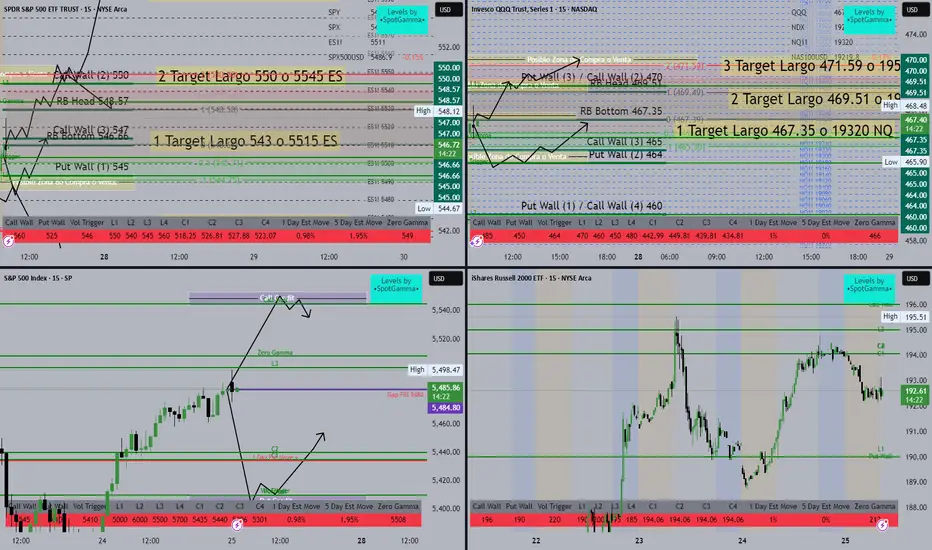
The chart integrates SpotGamma levels, option walls, and potential reaction zones. It's designed to anticipate long trade setups based on call/put walls and retracement zones.
🔑 Key Zones and Levels
Zone/Level Description
464 – 465 (Put/Call Walls) Strong support zone, ideal for potential long setups (Buy Zone).
467.35 – RB Bottom First key resistance zone or target if price bounces from support.
469.51 – RB Head Second target/resistance based on call wall and options positioning.
471.59 – 470 (Call Wall) Final upside target. Possible reversal zone or strong supply zone.
🧠 Trade Ideas (Long Bias)
Scenario 1 – Early Bounce:
Entry Zone: Between 464 – 465
Target 1: 467.35 (RB Bottom)
Target 2: 469.51 (RB Head)
Target 3: 471.59
Scenario 2 – Retest Before Breakout:
Price may retest the Put Wall (2) at 464 before pushing higher.
This gives another buying opportunity with confirmation from price action.
Scenario 3 – Mid-range Consolidation:
Watch the 467.35 level for a breakout/rejection.
Above 467.35 with volume → bullish continuation toward 470–471.
⚠️ Critical Notes
Vol Trigger @ 466: This is a pivot level. Holding above suggests bullish bias; below = caution.
Zero Gamma Level @ 466: Another critical inflection point—watch reactions here closely.
General Context:
The chart integrates SpotGamma levels, option walls, and potential reaction zones. It's designed to anticipate long trade setups based on call/put walls and retracement zones.
🔑 Key Zones and Levels
Zone/Level Description
464 – 465 (Put/Call Walls) Strong support zone, ideal for potential long setups (Buy Zone).
467.35 – RB Bottom First key resistance zone or target if price bounces from support.
469.51 – RB Head Second target/resistance based on call wall and options positioning.
471.59 – 470 (Call Wall) Final upside target. Possible reversal zone or strong supply zone.
🧠 Trade Ideas (Long Bias)
Scenario 1 – Early Bounce:
Entry Zone: Between 464 – 465
Target 1: 467.35 (RB Bottom)
Target 2: 469.51 (RB Head)
Target 3: 471.59
Scenario 2 – Retest Before Breakout:
Price may retest the Put Wall (2) at 464 before pushing higher.
This gives another buying opportunity with confirmation from price action.
Scenario 3 – Mid-range Consolidation:
Watch the 467.35 level for a breakout/rejection.
Above 467.35 with volume → bullish continuation toward 470–471.
⚠️ Critical Notes
Vol Trigger @ 466: This is a pivot level. Holding above suggests bullish bias; below = caution.
Zero Gamma Level @ 466: Another critical inflection point—watch reactions here closely.
Disclaimer
The information and publications are not meant to be, and do not constitute, financial, investment, trading, or other types of advice or recommendations supplied or endorsed by TradingView. Read more in the Terms of Use.
Disclaimer
The information and publications are not meant to be, and do not constitute, financial, investment, trading, or other types of advice or recommendations supplied or endorsed by TradingView. Read more in the Terms of Use.