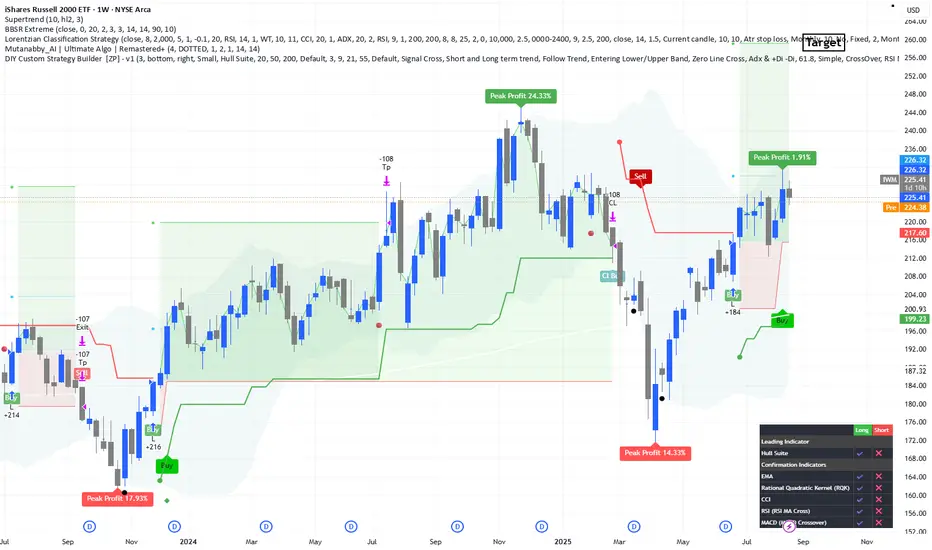
Spotted a promising long setup on the iShares Russell 2000 ETF (IWM) weekly chart. The price action is showing bullish momentum supported by volume and trend indicators.
🔹 Entry Zone: Current levels
🔹 Stop Loss: 196$ – below super trend line
🔹 Target: 260$
Technical indicators and moving averages are aligning for a potential breakout. Risk management is key – keep an eye on volume and macro sentiment.
Let me know your thoughts or if you're watching IWM too!
#IWM #Russell2000 #ETF #TechnicalAnalysis #SwingTrade #TradingSetup #Finance
Disclaimer
The information and publications are not meant to be, and do not constitute, financial, investment, trading, or other types of advice or recommendations supplied or endorsed by TradingView. Read more in the Terms of Use.
Disclaimer
The information and publications are not meant to be, and do not constitute, financial, investment, trading, or other types of advice or recommendations supplied or endorsed by TradingView. Read more in the Terms of Use.