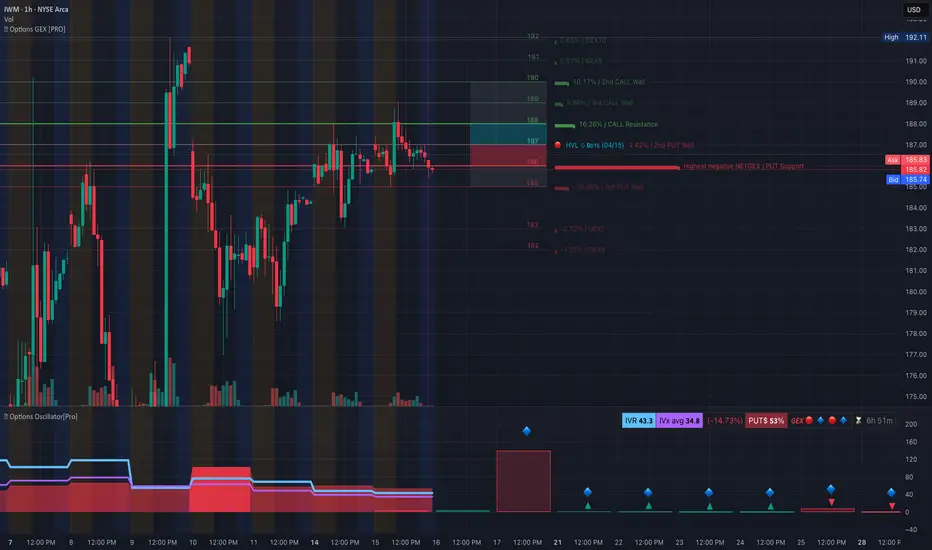
🔮 GEX (Gamma Exposure) – Options Sentiment Overview
🚨 High-Risk Gamma Pivot Around 186–185.8
* IWM is sitting exactly on its highest negative NET GEX zone at 185.82, making this a key inflection point.
* Dealers are likely long gamma here — a break below can force rapid adjustments, pushing the ETF toward 183–182, where more negative GEX builds.
🔺 Dense CALL Walls at 187–190–192
* There’s strong CALL resistance stacked between 187.94 and 192.12, with 190 and 192 showing large hedging flow.
* Any upside attempt will likely stall into these zones without strong volume or macro support.
📊 GEX Sentiment Breakdown:
* IVR: 43.3 → Moderately elevated, volatility potential remains.
* IVx avg: 34.8, currently down –14.73%, signals a possible volatility contraction, which could hurt premium buyers and favor a grind or drop.
* PUTS: 53% → Extremely heavy PUT positioning, indicating dealers are short gamma to the downside and could fuel accelerated selloffs if 185 fails.
🎯 GEX Flow Summary:
* If 186 holds, expect more chop between 186–188.
* If 185.8 breaks, price could snap toward 183 → 182 → 180, where next levels of PUT walls await.
🕰️ Technical Analysis – 1 Hour Chart Breakdown

Price Structure:
* Price is tightly coiled at the apex of a descending triangle.
* Support is showing stress at 184.97–185.8, with lower highs forming — this looks bearish unless bulls reclaim the wedge.
Indicator Confirmation:
* MACD: Flat and neutral, no bullish crossover in sight.
* RSI: Grinding lower under 50, consistent with bear pressure building.
Levels to Watch:
* Support: 185.8 → 183 → 182 → 180
* Resistance: 187.9 → 190 → 192.1
🧠 Final Thoughts:
IWM is caught at a crucial gamma pivot with both sides hedged and waiting. Dealers are loaded with PUTs — if this slips under 185.8, we could see amplified selling toward 182 or even lower. However, if bulls reclaim 187.5 and flip VWAP, then 190 becomes possible.
This is a gamma squeeze waiting for a trigger — prepare for volatility.
This analysis is for educational purposes only and does not constitute financial advice. Always use proper risk management and let price confirm your bias.
🚨 High-Risk Gamma Pivot Around 186–185.8
* IWM is sitting exactly on its highest negative NET GEX zone at 185.82, making this a key inflection point.
* Dealers are likely long gamma here — a break below can force rapid adjustments, pushing the ETF toward 183–182, where more negative GEX builds.
🔺 Dense CALL Walls at 187–190–192
* There’s strong CALL resistance stacked between 187.94 and 192.12, with 190 and 192 showing large hedging flow.
* Any upside attempt will likely stall into these zones without strong volume or macro support.
📊 GEX Sentiment Breakdown:
* IVR: 43.3 → Moderately elevated, volatility potential remains.
* IVx avg: 34.8, currently down –14.73%, signals a possible volatility contraction, which could hurt premium buyers and favor a grind or drop.
* PUTS: 53% → Extremely heavy PUT positioning, indicating dealers are short gamma to the downside and could fuel accelerated selloffs if 185 fails.
🎯 GEX Flow Summary:
* If 186 holds, expect more chop between 186–188.
* If 185.8 breaks, price could snap toward 183 → 182 → 180, where next levels of PUT walls await.
🕰️ Technical Analysis – 1 Hour Chart Breakdown
Price Structure:
* Price is tightly coiled at the apex of a descending triangle.
* Support is showing stress at 184.97–185.8, with lower highs forming — this looks bearish unless bulls reclaim the wedge.
Indicator Confirmation:
* MACD: Flat and neutral, no bullish crossover in sight.
* RSI: Grinding lower under 50, consistent with bear pressure building.
Levels to Watch:
* Support: 185.8 → 183 → 182 → 180
* Resistance: 187.9 → 190 → 192.1
🧠 Final Thoughts:
IWM is caught at a crucial gamma pivot with both sides hedged and waiting. Dealers are loaded with PUTs — if this slips under 185.8, we could see amplified selling toward 182 or even lower. However, if bulls reclaim 187.5 and flip VWAP, then 190 becomes possible.
This is a gamma squeeze waiting for a trigger — prepare for volatility.
This analysis is for educational purposes only and does not constitute financial advice. Always use proper risk management and let price confirm your bias.
Disclaimer
The information and publications are not meant to be, and do not constitute, financial, investment, trading, or other types of advice or recommendations supplied or endorsed by TradingView. Read more in the Terms of Use.
Disclaimer
The information and publications are not meant to be, and do not constitute, financial, investment, trading, or other types of advice or recommendations supplied or endorsed by TradingView. Read more in the Terms of Use.