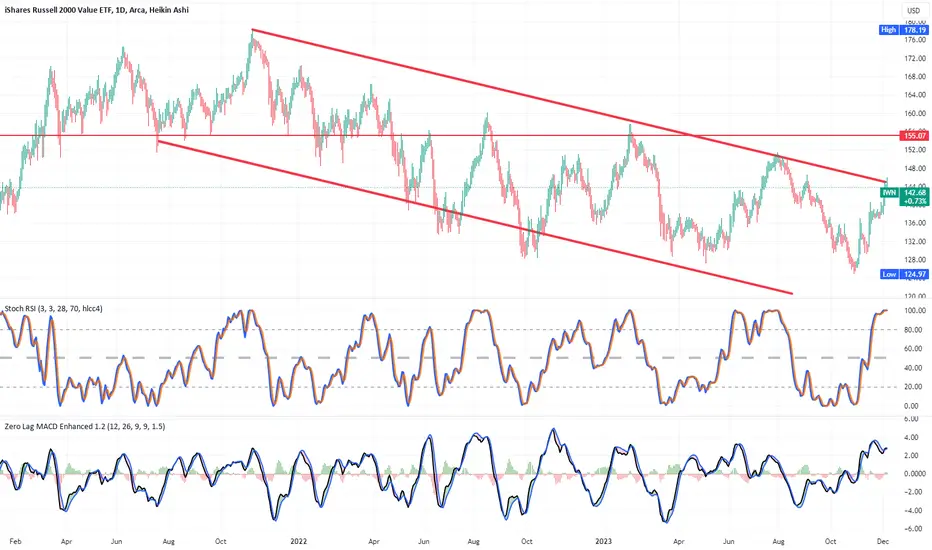
IWN on the reliable daily chart has been trending down for two in a descending channel as
shown on the chart with upper and lower trendlines drawn with the tool. The Stochastic RSI
oscillates in the interval between oversold and over bought and presently is well
overbought at nearly 100. While the RSI may double top like it did in July, it is at least right now
at the first top. The zero lag MACD is confirmatory with a K/D line cross well above the
histogram. I will play this by buying a put option at a strike of $ 150 for October 24
If Biden tries to prompt up the market to gain a re- election and is successful, this will get
stopped out. If interest rates are not pulled back by the fed soon, small caps will continue to get crushed.
On the other hand when rates are pulled back, they will be nimble and recover quicker than
the large caps and it will get stopped out. I think the fed will pullback rates to help Biden
out, although the fed is not partisan ?
Oil prices in their downward trend lend support to a slow fall off in the inflation rate.
What goes for IWN also goes for DIA.
Disclaimer
The information and publications are not meant to be, and do not constitute, financial, investment, trading, or other types of advice or recommendations supplied or endorsed by TradingView. Read more in the Terms of Use.
Disclaimer
The information and publications are not meant to be, and do not constitute, financial, investment, trading, or other types of advice or recommendations supplied or endorsed by TradingView. Read more in the Terms of Use.