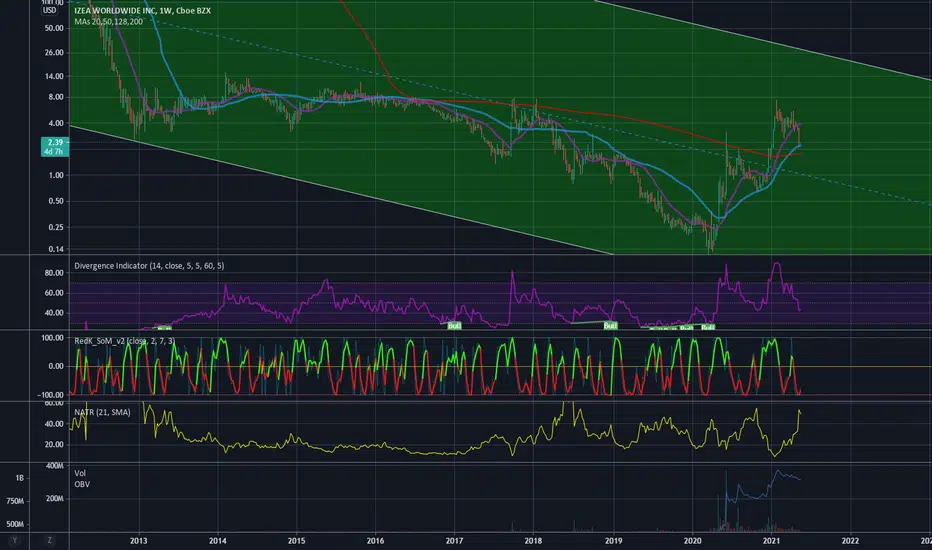
is it time for izea to go up once again?
as u can see, for the past 3 years the MA 50 in weekly chart worked as a support ALWAYS.
just put SL close below it, and you'll be fine
consider tho, that we have MA 200 close too (but lower ofc)
as u can see, for the past 3 years the MA 50 in weekly chart worked as a support ALWAYS.
just put SL close below it, and you'll be fine
consider tho, that we have MA 200 close too (but lower ofc)
Note
ok check this outusually, traders use a daily chart, right?
the weekly chart is considered for long term play
so, because and thanks to that, there are you option
1) a lot of people are investing in this stock LONG TERM
2) big guys are trying to get our money using DAILY CHART and fkin** us really hard using WEEKLY CHART to organize and to follow.
here is the proof
in the hrs chart, we dipped BELOW MA200 DAY! that's HUGE!!!
but, in the weekly chart, as it is shown in the idea itself, but also below, they DID make it bounce on the MA50 (+24%) that's HUGE too!!
Note
and yes, I did play that bounce buying at the MA 50 (my entry price: 2.31)Trade closed manually
closed at 3.00 USD. i don't like to play when the market is so volatile and in downtrend yet.Related publications
Disclaimer
The information and publications are not meant to be, and do not constitute, financial, investment, trading, or other types of advice or recommendations supplied or endorsed by TradingView. Read more in the Terms of Use.
Related publications
Disclaimer
The information and publications are not meant to be, and do not constitute, financial, investment, trading, or other types of advice or recommendations supplied or endorsed by TradingView. Read more in the Terms of Use.