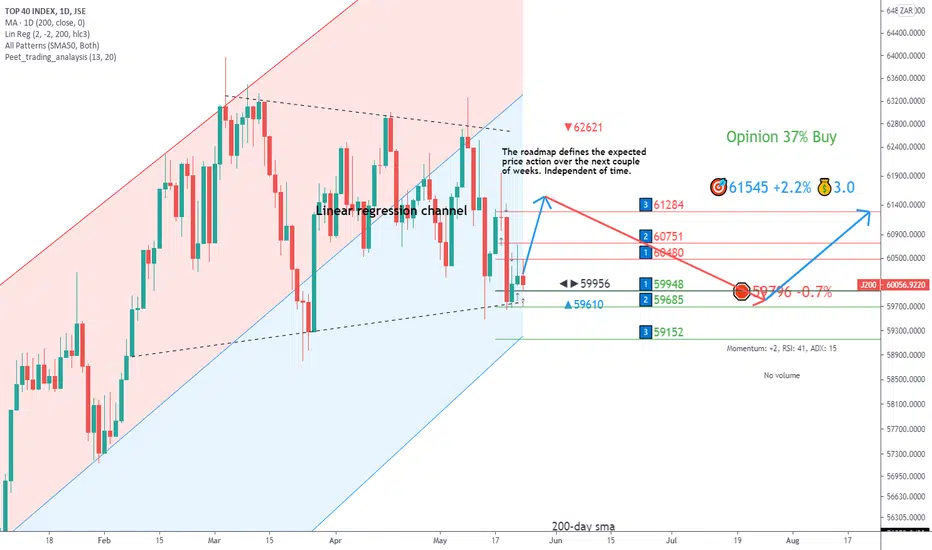
Upside price momentum supports the bullish trend direction.
Bullish trend above 59956.
RSI leaves enough room for further upside price potential.
The red and blue parallel lines are the 200-day linear regression channel pattern. A price action close to the boundaries increases the likelihood of a correction
Bullish trend above 59956.
RSI leaves enough room for further upside price potential.
The red and blue parallel lines are the 200-day linear regression channel pattern. A price action close to the boundaries increases the likelihood of a correction
Disclaimer
The information and publications are not meant to be, and do not constitute, financial, investment, trading, or other types of advice or recommendations supplied or endorsed by TradingView. Read more in the Terms of Use.
Disclaimer
The information and publications are not meant to be, and do not constitute, financial, investment, trading, or other types of advice or recommendations supplied or endorsed by TradingView. Read more in the Terms of Use.