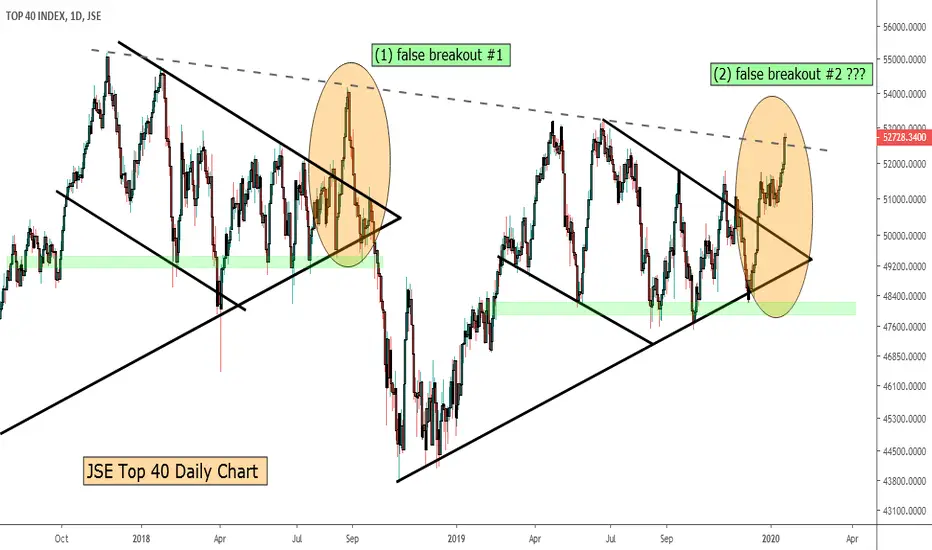
The current technical setup is reminiscent of the August 2018 period where we saw the index break to the upside a bullish flag formation, producing a 5% move on the break. At current levels, the price is around 4.6% above the breakout level, with a slight overshoot and test of the resistance trend line going back to November 2017. We are also 9.3% (or 4400 points) up from the 4-December-2019 lows. Keeping an open mind for a potential retracement.
Disclaimer
The information and publications are not meant to be, and do not constitute, financial, investment, trading, or other types of advice or recommendations supplied or endorsed by TradingView. Read more in the Terms of Use.
Disclaimer
The information and publications are not meant to be, and do not constitute, financial, investment, trading, or other types of advice or recommendations supplied or endorsed by TradingView. Read more in the Terms of Use.