Updated
J210 VS J211 VS J212
$J210 VS $JSE:J211 vs $JSE:J212
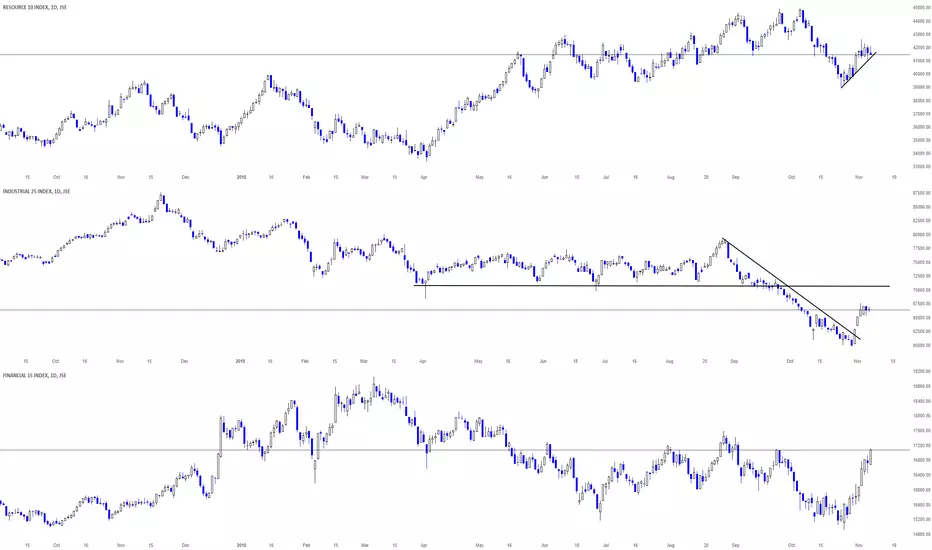
Three chart next to each other
Resi10 making bearish flag with more downside likely
Indi25 should test resistance around 70000
Fini15 looks strongest over last two weeks or so. More upside likely towards resistance at 175000
Three chart next to each other
Resi10 making bearish flag with more downside likely
Indi25 should test resistance around 70000
Fini15 looks strongest over last two weeks or so. More upside likely towards resistance at 175000
Note
Break of bearish flag on J210 RES10 Target some 10% lower
Trade active
J210 broke bearish flag tested previous low and stopped there for now. This does not look as strong bounce so break of low from 24 October is very possible next week. That will cause more downside J211 Similar situation like J210. Tested again low from late October. Bounce last week didn't produce much and break of the low can be expected next week
J212 Looks strongest of all. Massive resistance just above that can cause a problem to break. It looks more or less as cup so far and need handle to be made. If you would like to go long this is your best bet for now, especially if it breaks above resistance
Disclaimer
The information and publications are not meant to be, and do not constitute, financial, investment, trading, or other types of advice or recommendations supplied or endorsed by TradingView. Read more in the Terms of Use.
Disclaimer
The information and publications are not meant to be, and do not constitute, financial, investment, trading, or other types of advice or recommendations supplied or endorsed by TradingView. Read more in the Terms of Use.