Hello, traders.
If you "Follow", you can always get the latest information quickly.
Have a nice day today.
-------------------------------------
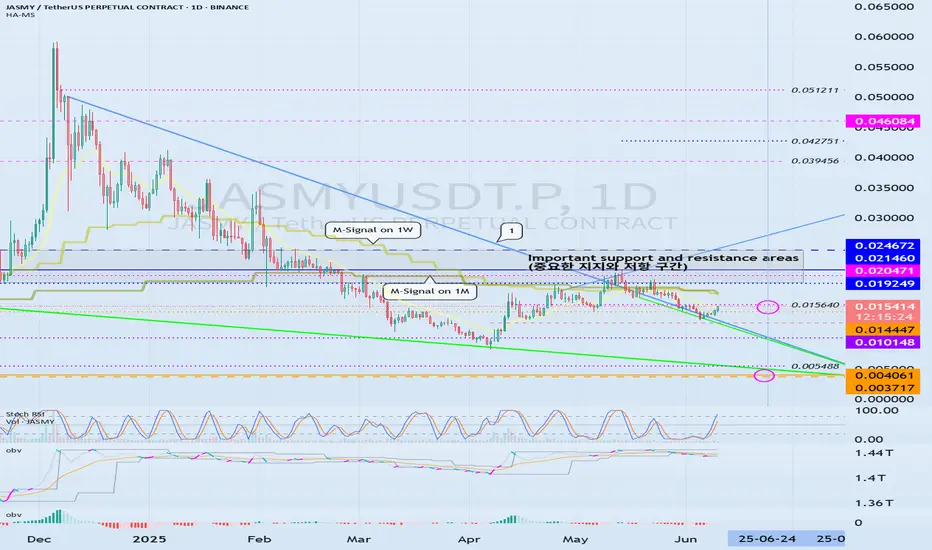
(JASMYUSDT.P 1D chart)
It is showing signs of breaking away from the medium- to long-term downtrend line (1).
However, since it is located below the M-Signal indicator of the 1M chart, a short and quick response is required when trading.
It is expected that the price will start to rise if it rises above the important support and resistance area of 0.019249-0.024672 and maintains the price.
Even if it does not rise and falls, if the price is maintained above the downtrend line (1), it is expected that there will be an increase to eventually rise to the important support and resistance area.
The volatility period is around June 24, which is similar to the BTC volatility period, so it seems that it will have a big impact on the movement of BTC.
Since the HA-Low indicator of the 1D chart is formed at the 0.014447 point, if it is supported, it is an aggressive buying period.
-
Thank you for reading to the end.
I hope you have a successful transaction.
--------------------------------------------------
- This is an explanation of the big picture.
(3-year bull market, 1-year bear market pattern)

I will explain more details when the bear market starts.
------------------------------------------------------
Other content (coins, stocks, etc.) is frequently posted on X.
X에 다른 내용(코인, 주식 등)이 자주 게시.
◆ t.me/readCryptoChannel
[HA-MS Indicator]
bit.ly/3YxHgvN
[OBV Indicator]
bit.ly/4dcyny3
X에 다른 내용(코인, 주식 등)이 자주 게시.
◆ t.me/readCryptoChannel
[HA-MS Indicator]
bit.ly/3YxHgvN
[OBV Indicator]
bit.ly/4dcyny3
Related publications
Disclaimer
The information and publications are not meant to be, and do not constitute, financial, investment, trading, or other types of advice or recommendations supplied or endorsed by TradingView. Read more in the Terms of Use.