📌 Chart Explanation:
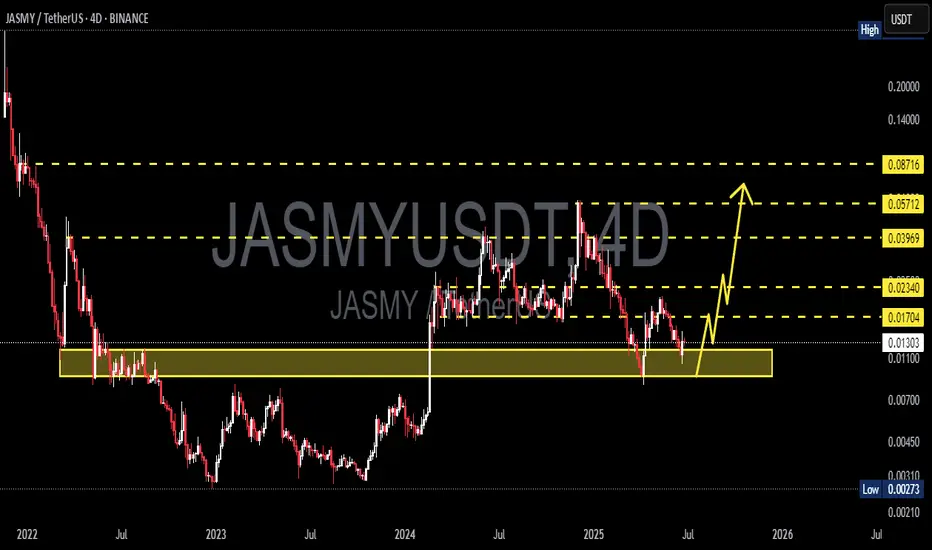
JASMY is showing strong potential for a bullish reversal from the key demand zone (highlighted in yellow) around the $0.01100–$0.01300 range. This zone has historically acted as a major support level since 2022, and it has just been successfully retested during the latest correction.
Following this bounce, price action indicates the beginning of a possible uptrend formation. If bullish momentum continues, we may see price reaching multiple resistance targets on the way up:
🎯 Upside Targets (Resistance Levels):
1. 🟡 $0.01704 – Minor resistance
2. 🟡 $0.02340 – Medium resistance
3. 🟡 $0.03969 – Previous major swing high
4. 🟡 $0.05712 – Psychological target
5. 🟡 $0.08716 – Mid-term target
✅ Bullish Signals:
Strong bounce from historical support implies possible accumulation.
Early signs of Higher Low formation.
Potential gain exceeding +500% if upper targets are achieved.
⚠️ Risk Note:
If the $0.01100 support fails, this bullish scenario becomes invalid.
Beware of fakeouts or potential bull traps.
🧠 Conclusion:
JASMY is setting up for a possible bull run from the golden support zone. As long as price stays above $0.01100, the mid-term outlook remains bullish.
#JASMY #JASMYUSDT #CryptoAnalysis #AltcoinSeason #BreakoutCrypto #BinanceAnalysis #TechnicalAnalysis #CryptoSignals #BullishSetup #SupportRebound
✅ Get Free Signals! Join Our Telegram Channel Here: t.me/TheCryptoNuclear
✅ Twitter: twitter.com/crypto_nuclear
✅ Join Bybit : partner.bybit.com/b/nuclearvip
✅ Benefits : Lifetime Trading Fee Discount -50%
✅ Twitter: twitter.com/crypto_nuclear
✅ Join Bybit : partner.bybit.com/b/nuclearvip
✅ Benefits : Lifetime Trading Fee Discount -50%
Disclaimer
The information and publications are not meant to be, and do not constitute, financial, investment, trading, or other types of advice or recommendations supplied or endorsed by TradingView. Read more in the Terms of Use.