Hello dear reader, how are you feeling?
Jasmycoin, the chart shows much that needs to be considered. It is a mixture of bullish developments with bullish potential but a risk of unexpected change... Let's get to it and see what the JASMYUSDT chart says.
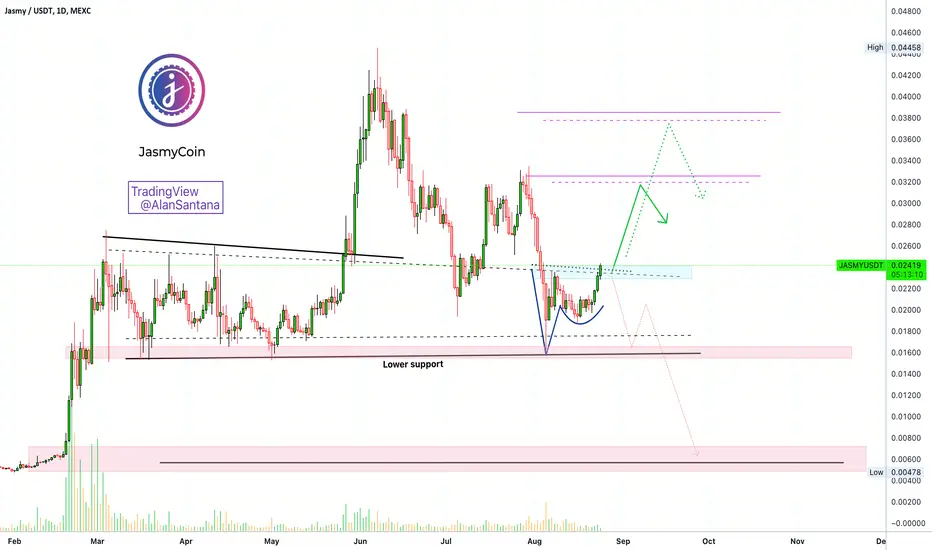
Notice the "lower support" line, black. This level has been holding since March 2024.
When Jasmy dropped in August, it bounced off this line and produce a higher low. This is a bullish development and defines this level as relevant for any downward move.
Right now we are seeing a reversal pattern, Adam & Eve, after a major drop. This pattern leads to higher prices.
While higher is possible, it is hard to see "long-term" higher here.
We are more likely witnessing the start of a bullish wave that will invariably be followed by a strong bearish move. The bearish move will be followed by an accumulation phase and then sustained growth.
This is based on the fact that the bounce is happening at relatively high prices and a major peak is just a few months away. This peak, or half through it, can work as strong resistance; this is depicted on the chart.
This chart is on a decision point so things can quickly and easily change.
Namaste.
Jasmycoin, the chart shows much that needs to be considered. It is a mixture of bullish developments with bullish potential but a risk of unexpected change... Let's get to it and see what the JASMYUSDT chart says.
Notice the "lower support" line, black. This level has been holding since March 2024.
When Jasmy dropped in August, it bounced off this line and produce a higher low. This is a bullish development and defines this level as relevant for any downward move.
Right now we are seeing a reversal pattern, Adam & Eve, after a major drop. This pattern leads to higher prices.
While higher is possible, it is hard to see "long-term" higher here.
We are more likely witnessing the start of a bullish wave that will invariably be followed by a strong bearish move. The bearish move will be followed by an accumulation phase and then sustained growth.
This is based on the fact that the bounce is happening at relatively high prices and a major peak is just a few months away. This peak, or half through it, can work as strong resistance; this is depicted on the chart.
This chart is on a decision point so things can quickly and easily change.
Namaste.
🚨 TOP FREE Trades
ETH +1450% · AAVE +1134%
XRP +749% · DOGS +868%
BTC +563% · SOL +658%
t.me/anandatrades/1350
🚨 FREE Analyses & New Results
t.me/masteranandatrades/6499
🚨 PREMIUM LIFETIME (Since 2017)
lamatrades.com
ETH +1450% · AAVE +1134%
XRP +749% · DOGS +868%
BTC +563% · SOL +658%
t.me/anandatrades/1350
🚨 FREE Analyses & New Results
t.me/masteranandatrades/6499
🚨 PREMIUM LIFETIME (Since 2017)
lamatrades.com
Related publications
Disclaimer
The information and publications are not meant to be, and do not constitute, financial, investment, trading, or other types of advice or recommendations supplied or endorsed by TradingView. Read more in the Terms of Use.