Jabil Inc. (JBL) is pressing into all-time highs with strong momentum, and both RSI and MACD support further upside — but this is a textbook spot where trend traders must watch for a breakout confirmation or a double top trap.
Technical Breakdown
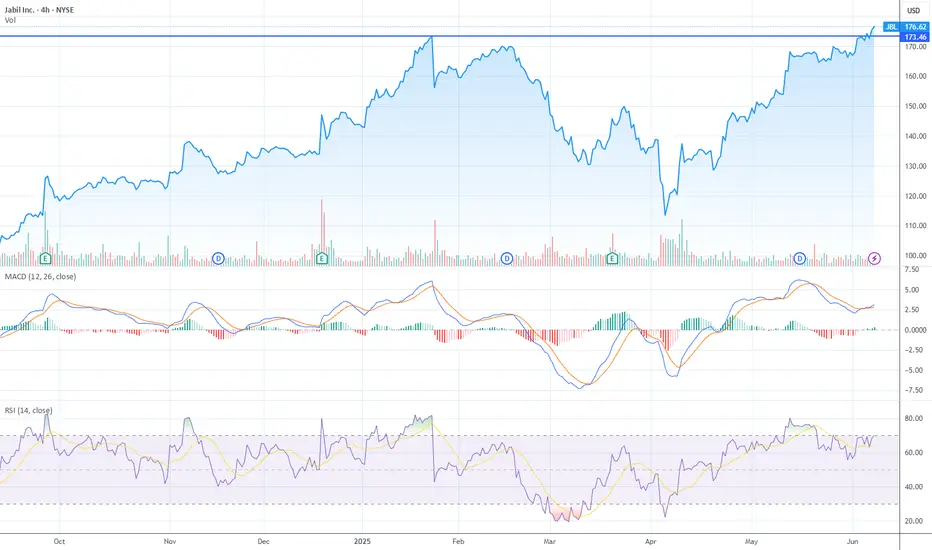
1. Price Action – Testing All-Time Highs (~$176)
JBL is now retesting its prior high from March 2025 after a steep recovery off the ~$115 lows. The move has been orderly and relentless, showing strong demand with minimal corrective pullbacks. Price is at an inflection point: either it breaks through and enters price discovery mode, or stalls for a potential double top.
2. MACD – Bullish Continuation Setup
MACD is currently bullishly crossed and rising steadily. Histogram is green, but not spiking, suggesting sustainable momentum — not overextended. This is a healthy mid-trend momentum pattern — no signs of exhaustion yet.
3. RSI – Elevated, But Not Overbought
RSI is at 76.79, slightly into overbought territory. This supports the bullish case as long as it stays above 60–65 on any pullback. However, if RSI rolls over while price fails to break above $176, a bearish divergence could develop.
4. Volume – Needs Confirmation
Volume isn’t surging yet — which makes this a “show me” breakout attempt. A convincing breakout would ideally need a volume spike and a strong daily close above $176.
Fibonacci Extension Setup
We’ll anchor the extension to the most recent strong impulse leg, from the March 2025 low to the current resistance area:
Swing low: ~$115 (March 2025)
Swing high (resistance): ~$176 (current all-time high)
Pullback low: ~$155 (early May consolidation)
This gives us a base leg of ~$61 in length ($176 - $115).
Fibonacci Extension Targets
Fib Level Price Target Commentary
1.0x $176 ✅ Already hit — major resistance
1.272 $194–195 First breakout target — conservative
1.618 $210–212 Primary trend continuation target
2.0 $237 Stretch target — euphoria or AI tailwinds
Final Take
If JBL breaks above $176 with confirmation, the Fibonacci extension suggests a primary upside target at $194–212 — with $237 as a stretch target if the move accelerates.
Technical Breakdown
1. Price Action – Testing All-Time Highs (~$176)
JBL is now retesting its prior high from March 2025 after a steep recovery off the ~$115 lows. The move has been orderly and relentless, showing strong demand with minimal corrective pullbacks. Price is at an inflection point: either it breaks through and enters price discovery mode, or stalls for a potential double top.
2. MACD – Bullish Continuation Setup
MACD is currently bullishly crossed and rising steadily. Histogram is green, but not spiking, suggesting sustainable momentum — not overextended. This is a healthy mid-trend momentum pattern — no signs of exhaustion yet.
3. RSI – Elevated, But Not Overbought
RSI is at 76.79, slightly into overbought territory. This supports the bullish case as long as it stays above 60–65 on any pullback. However, if RSI rolls over while price fails to break above $176, a bearish divergence could develop.
4. Volume – Needs Confirmation
Volume isn’t surging yet — which makes this a “show me” breakout attempt. A convincing breakout would ideally need a volume spike and a strong daily close above $176.
Fibonacci Extension Setup
We’ll anchor the extension to the most recent strong impulse leg, from the March 2025 low to the current resistance area:
Swing low: ~$115 (March 2025)
Swing high (resistance): ~$176 (current all-time high)
Pullback low: ~$155 (early May consolidation)
This gives us a base leg of ~$61 in length ($176 - $115).
Fibonacci Extension Targets
Fib Level Price Target Commentary
1.0x $176 ✅ Already hit — major resistance
1.272 $194–195 First breakout target — conservative
1.618 $210–212 Primary trend continuation target
2.0 $237 Stretch target — euphoria or AI tailwinds
Final Take
If JBL breaks above $176 with confirmation, the Fibonacci extension suggests a primary upside target at $194–212 — with $237 as a stretch target if the move accelerates.
Disclaimer
The information and publications are not meant to be, and do not constitute, financial, investment, trading, or other types of advice or recommendations supplied or endorsed by TradingView. Read more in the Terms of Use.
Disclaimer
The information and publications are not meant to be, and do not constitute, financial, investment, trading, or other types of advice or recommendations supplied or endorsed by TradingView. Read more in the Terms of Use.