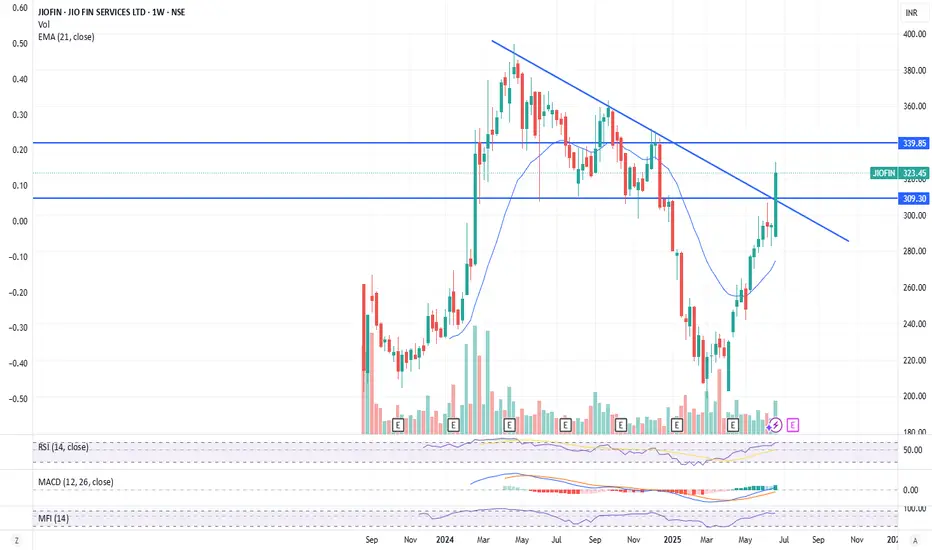
Jio Financial Services stock shows strong potential for growth on the weekly technical chart based on multiple technical indicators and moving averages signaling bullish momentum:
Strong Buy Signals Across Moving Averages: All key moving averages (5, 10, 20, 50, 100, and 200-day SMAs and EMAs) are indicating a "Buy" or "Strong Buy" signal, reflecting sustained upward price momentum over various time frames.
Bullish Technical Indicators: Indicators such as MACD, ADX, CCI, ROC, and Ultimate Oscillator are all showing buy signals, supporting a positive trend continuation. For example, MACD is positive and rising, ADX at 46.6 indicates a strong trend, and CCI at 177.7 confirms bullish momentum.
Overbought but Strong Momentum: Although the RSI (14) is overbought at 81.3, which typically signals caution, in strong trending markets this can indicate continued strength rather than an immediate reversal.
Price Action and Pivot Levels: The stock price is currently above key pivot points and resistance levels, with classic pivot resistance around 329-335 levels, suggesting room for further upward movement before significant resistance is encountered.
Recent Price Performance: Jio Financial has gained nearly 10% in the past week and over 11% in the last month, demonstrating strong recent buying interest and momentum.
Volatility and Volume Support: The ATR (Average True Range) indicates high volatility, which can fuel strong price moves, and the Bull/Bear Power indicator confirms buyers' dominance.
In summary, the weekly technical chart for Jio Financial Services reflects a robust bullish setup with multiple moving averages and momentum indicators aligned on the buy side, supported by recent strong price gains and favorable pivot levels. This technical landscape suggests a high probability of continued price appreciation in the near term on the weekly timeframe
Disclaimer
The information and publications are not meant to be, and do not constitute, financial, investment, trading, or other types of advice or recommendations supplied or endorsed by TradingView. Read more in the Terms of Use.
Disclaimer
The information and publications are not meant to be, and do not constitute, financial, investment, trading, or other types of advice or recommendations supplied or endorsed by TradingView. Read more in the Terms of Use.