Good morning traders!
🔸This morning while we were checking our stock watchlist, we were struck by the behavior of JMIA. This year has given numerous bullish opportunities given the extreme rise it had (more than 1000%), which is why it has been an excessively attractive instrument for most trend traders or momentum traders.
🔸The curious thing about this stock is that the party is not over yet. The behavior that can be observed is that it is the classic pattern of parabolic movements. Many instruments generate this pattern, and one of them, well known, is the Bitcoin.
📝 What does this pattern imply?

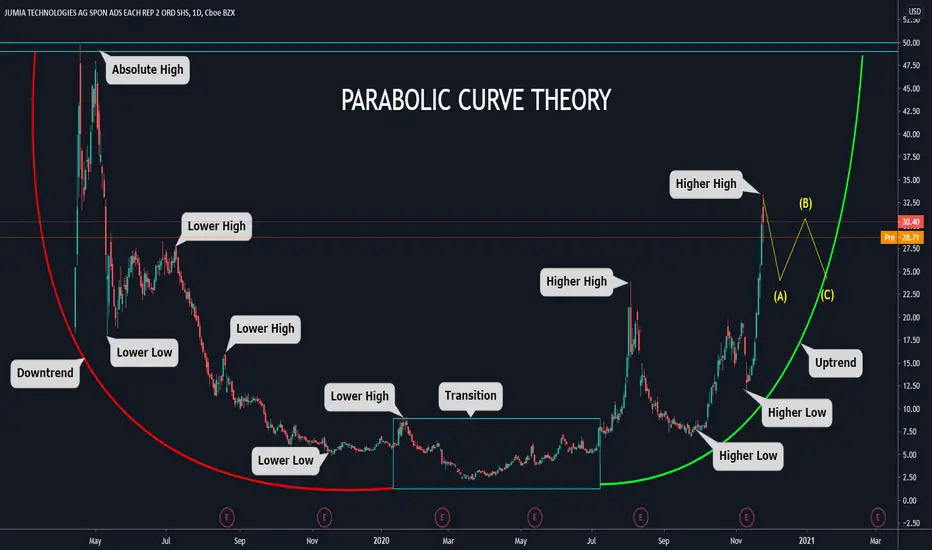
🔸Well, as we can see, throughout the past year the behavior was a neat downtrend, with impulses and corrections all in the same direction, generating lower highs and lows.
🔸Now, at the beginning of this year we see that the price finds a clear bottom, and stops generating downside impulses.
🔸It moves in a range without generating clear direction, and then has an explosive move to the upside.
🔸This entire consolidation period was a great accumulation, to then start the bullish rally that we saw throughout 2020.
🔸After the bullish breakout, we see that the price generates a clear uptrend, with increasing highs and lows.
📝 Where are we now?
🔸At this time we are at the highest price for the year, and we see that in this same area, in the previous trend, it was a correction zone. Therefore, we expect a short-term corrective movement in the current price zone, to then continue the uptrend towards the all-time highs.
🔸Once we get to that level, there are certain behaviors to expect that we will develop once we see a clear horizon.
🔸This morning while we were checking our stock watchlist, we were struck by the behavior of JMIA. This year has given numerous bullish opportunities given the extreme rise it had (more than 1000%), which is why it has been an excessively attractive instrument for most trend traders or momentum traders.
🔸The curious thing about this stock is that the party is not over yet. The behavior that can be observed is that it is the classic pattern of parabolic movements. Many instruments generate this pattern, and one of them, well known, is the Bitcoin.
📝 What does this pattern imply?
🔸Well, as we can see, throughout the past year the behavior was a neat downtrend, with impulses and corrections all in the same direction, generating lower highs and lows.
🔸Now, at the beginning of this year we see that the price finds a clear bottom, and stops generating downside impulses.
🔸It moves in a range without generating clear direction, and then has an explosive move to the upside.
🔸This entire consolidation period was a great accumulation, to then start the bullish rally that we saw throughout 2020.
🔸After the bullish breakout, we see that the price generates a clear uptrend, with increasing highs and lows.
📝 Where are we now?
🔸At this time we are at the highest price for the year, and we see that in this same area, in the previous trend, it was a correction zone. Therefore, we expect a short-term corrective movement in the current price zone, to then continue the uptrend towards the all-time highs.
🔸Once we get to that level, there are certain behaviors to expect that we will develop once we see a clear horizon.
Disclaimer
The information and publications are not meant to be, and do not constitute, financial, investment, trading, or other types of advice or recommendations supplied or endorsed by TradingView. Read more in the Terms of Use.
Disclaimer
The information and publications are not meant to be, and do not constitute, financial, investment, trading, or other types of advice or recommendations supplied or endorsed by TradingView. Read more in the Terms of Use.