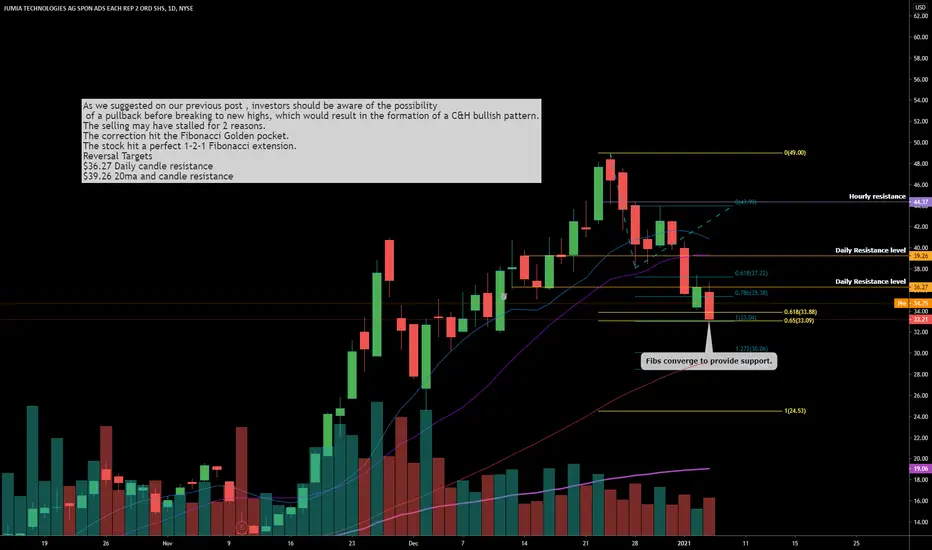
of a pullback before breaking to new highs, which would result in the formation of a C&H bullish pattern.
The selling may have stalled for 2 reasons.
The correction hit the Fibonacci Golden pocket.
The stock hit a perfect 1-2-1 Fibonacci extension.
Reversal Targets
$36.27 Daily candle resistance
$39.26 20ma and candle resistance
Note
Note
Potential, sorry about lazy drawingDisclaimer
The information and publications are not meant to be, and do not constitute, financial, investment, trading, or other types of advice or recommendations supplied or endorsed by TradingView. Read more in the Terms of Use.
Disclaimer
The information and publications are not meant to be, and do not constitute, financial, investment, trading, or other types of advice or recommendations supplied or endorsed by TradingView. Read more in the Terms of Use.