Jnug to Gold "a couple more days of upside before the big drop"
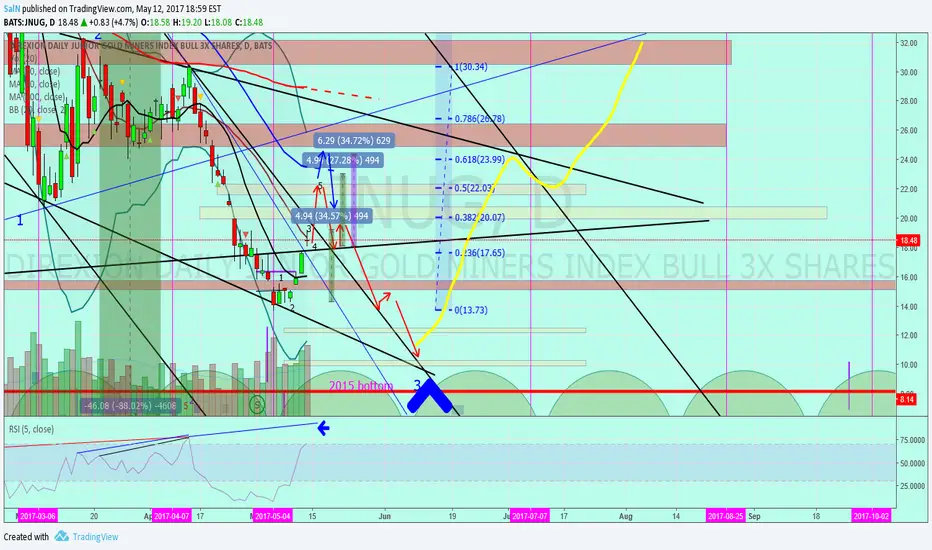
I think that we completed micro wave 3 and may have also completed a micro wave 4 today. I went ahead and, assuming that this was wave 3, I measured the price action from the start of wave 3 to the end. The I copy and pasted it and adjusted it to start from the bottom of what may be the bottom of wave 4. As you can see, if we get an equal price move for wave 5 then we should reach the $23 range. I am still being a little conservative with my first target at the top of the second gap fill. However, I also went ahead and took a measurement for an equal percentage move and you can see the purple measurement as well. And lastly you can see the Fib retracement on the far right. I am looking at a price somewhere in the 50% to 62% area. Wave 5 is supposed to be the longest for gold but not always. The COT report ends on Tuesday. Lets hope it is this time and maybe we can see the price move to touch the red resistance zone. That would be an easy sell and then I would buy JDST. Since we are due for an ICL and since there is a pretty good chance that the Fed raises rates in June, I will let our recent history steer me. That means that we should see gold fall until the FED meeting on June 14th. At that point, we should see gold rally for a decent time, into August, after the rate hike and I would expect Jnug to rally with it. The yellow hand drawn line is my expected path for a Jnug rally with gold. Looks like an ABC pattern to me. I will post the gold chart next. Oh one last thing. If Jnug does shoot up over the next two days, then the RSI 5 will be very overbought. I am predicting that it will extend higher than the top form last month and the month before that. That is a bog hidden bearish divergence possibly forming. Hmmmmmm?! So up for the next two days and then Crash. GL This is just my opinion.
and one more last thing. That big blue triangle at the bottom is the approximate date range when I believe gold will reach its ICL low. I also adjusted my cycles for Jnug. If we just started a new cycle for jnug, then it would make sense for it to end a little bit before the gold cycle ends. seems to fit. we will see
and one more last thing. That big blue triangle at the bottom is the approximate date range when I believe gold will reach its ICL low. I also adjusted my cycles for Jnug. If we just started a new cycle for jnug, then it would make sense for it to end a little bit before the gold cycle ends. seems to fit. we will see
Note
gold 4 hour chartAs you can see with this gold 4 hour chart, even though the daily does not look like we have done much of anything, this 4 hour chart looks like we are right with Jnug. I think we will get to the top of the wedge ($1240 - $1243) by Tuesday or Wednesday and then begin the fall to $1163.
Note
someone requested an update for Jnugthis is a 1 hour chart. This is my opinion on where we are at. I think we just completed a running flat type of correction and are now in wave 5.
Note
Jnug dailyat resistance and have not broken out this morning....yet. If we stay like this all day then I will not sell my Jnug. I will hold until we make a decent 5th wave.
Note
Gold chart update dailyJust in case anyone was wondering, we closed just above the 200 weekly MA which is what was resistance yesterday and today. But I do not believe that we will be able to push through what comes next. Above is a trend line, and a tick above that is a 200 DMA, and then the 50 DMA and then the dropping 20 DMA. So I think gold will get to the mid 1240's before resuming its drop down to 1163 - 1165
Note
JnugBarring something knocking gold down hard tomorrow morning, Jnug should open up outside of the downtrend line that it fought today and yesterday. Just for info, two fill the second gap would only be a 16.6% move, which is very doable. To get to the 50 DMA is about a 21% - 22% move which can happen but unlikely. We shall see. GL
Note
Jnug - Who sold today?Not me, I am posting the 15 minute chart to show you why I decided not to sell my jnug today.
Being that we gapped up and seemed to not move very much on the daily chart, I changed to the 15 minute chart to try to figure out where we were in the wave count. SO, I went ahead and labeled the chart, breaking down the larger wave 5 (black numbers) into the much smaller 5 wave structure within the wave 5 (red numbers). I think the chart clearly shows that we completed the wave 3 of 5 and wave 4 of 5 today and have just started the beginning of wave 5 of 5. I am pretty sure that we should at least fill the gap above and am hoping that we reach the 50 DMA on the daily which is the broken blue line above that gap. Not to mention, gold itself performed much better than I expected. It was fighting against the 50 week MA all day at the 1257 level but I think we closed above it at 1260 and that should bode well for tomorrow. I think that Jnug will be doen with in the first hour or two in the morning. I am pretty sure I am correct and would take profit and then jump into JDST. That is how I am planning on playing this. GL to whatever way you are playing the Jnug trade.
Note
Gold chart updateI may have been incorrect on my spot gold wave count. We might have just produced a wave 4 today on the daily and if the current move keeps up, then we should see wave 5 up to the top of the trend line possible up to as high as the low to mid 1280's. If I am correct, and we will find out possibly tomorrow, then Jnug is still not finished yet and should run higher than it did yesterday. The run could extend into early next week. GL
Disclaimer
The information and publications are not meant to be, and do not constitute, financial, investment, trading, or other types of advice or recommendations supplied or endorsed by TradingView. Read more in the Terms of Use.
Disclaimer
The information and publications are not meant to be, and do not constitute, financial, investment, trading, or other types of advice or recommendations supplied or endorsed by TradingView. Read more in the Terms of Use.