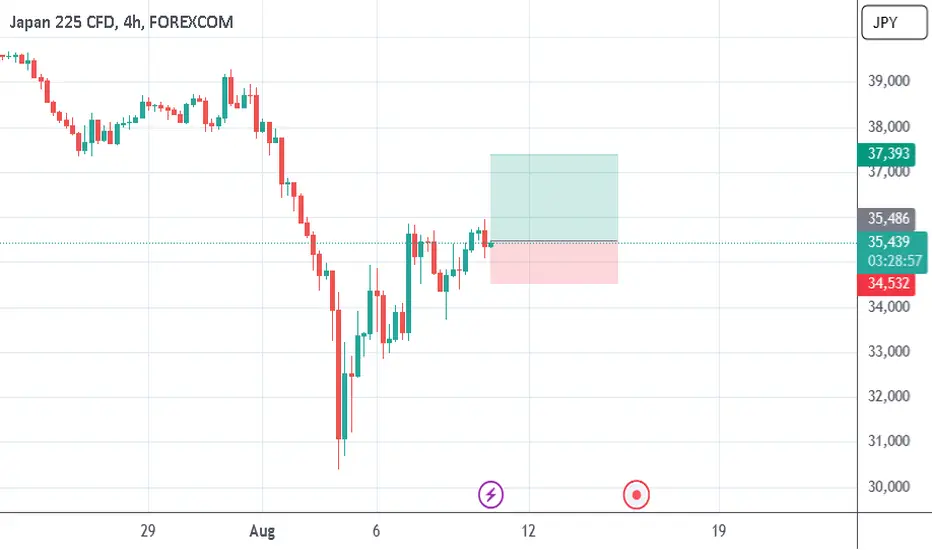
Here’s a bullish technical analysis for the Nikkei 225 (JP225) on the 4-hour (H4) chart:
Trend Analysis: The Nikkei 225 is currently showing signs of a potential bullish reversal. The price is moving within a rising trend channel, indicating increasing optimism among investors1.
Support and Resistance Levels:
Support: The key support level is around 30,423, which aligns with the recent low2.
Resistance: The first resistance level to watch is at 34,359.50, which is the recent high2.
Chart Patterns: The index has formed a bullish flag pattern, suggesting a continuation of the upward trend. This pattern is typically a sign of consolidation before a breakout1.
Indicators:
Relative Strength Index (RSI): The RSI is moving upwards, indicating increasing buying pressure.
Moving Averages (MA): The price is above the 50-period MA, which is a bullish signal.
MACD: The MACD line is above the signal line, suggesting bullish momentum.
Volume: Increasing trading volume on upward moves supports the bullish outlook, indicating strong buying interest.
Summary: If the price holds above the support level at 30,423 and breaks through the resistance at 34,359.50, we could see a continuation of the bullish trend. Traders might look for long opportunities with potential targets around 36,000 and higher.
Disclaimer
The information and publications are not meant to be, and do not constitute, financial, investment, trading, or other types of advice or recommendations supplied or endorsed by TradingView. Read more in the Terms of Use.
Disclaimer
The information and publications are not meant to be, and do not constitute, financial, investment, trading, or other types of advice or recommendations supplied or endorsed by TradingView. Read more in the Terms of Use.